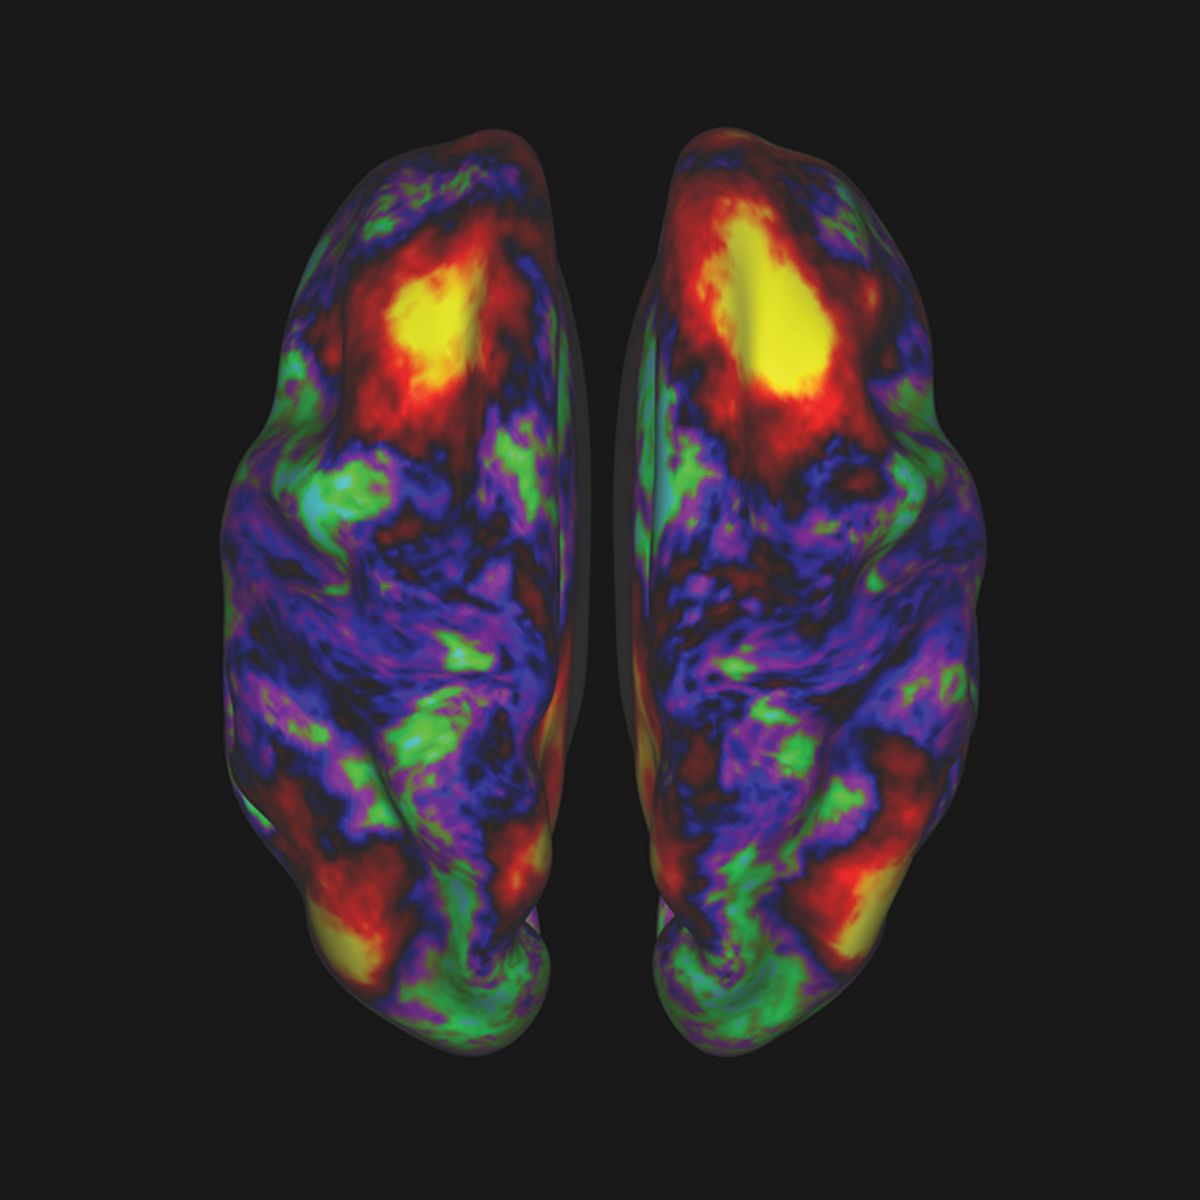
In early March, an unusual 2 terabytes of data hit the Web: the first batch of images from a massively ambitious brain-mapping effort called the Human Connectome Project. Thousands of images showed the brains of 68 healthy volunteers, with different regions glowing in bright jewel tones. These data, freely available for download via the project’s website, give neuroscientists unprecedented insights into which parts of the brain act in concert to do something as seemingly simple as recognizing a face.
The project leaders say their work is enabled by very recent advances in both brain-scanning hardware and image-processing software. “It simply wouldn’t have been feasible five or six years ago to provide this amount and quality of data, and the ability to work with the data,” says David Van Essen, one of the project’s principal investigators and head of the anatomy and neurobiology department at the Washington University School of Medicine, in St. Louis.
Based on a growing understanding that the mechanisms of perception and cognition involve networks of neurons that sprawl across multiple regions of the brain, researchers have begun mapping those neural circuits. While the Human Connectome Project looks at connections between brain regions, a US $100 million project, announced in April and called the BRAIN Initiative, will attempt to zoom in on the connectivity of small clusters of neurons.
But it’s the five-year Human Connectome Project that’s delivering the data now. The $40 million project funds two consortia; the larger, international group led by Van Essen and Kamil Ugurbil of the University of Minnesota will eventually scan the brains of 1200 adults, a group of twins and their siblings. The goal, says Van Essen, is “not just to infer what typical brain connectivity is like but also how it varies across participants, and how that relates to their different intellectual, cognitive, and emotional capabilities and attributes.”
To provide multiple perspectives on each brain, the researchers employ a number of cutting-edge imaging methods. They start with magnetic resonance imaging (MRI) scans to provide basic structural images of the brain, using both a 3-tesla machine and a next-generation 7-T scanner. Both provide extremely high-resolution images of the convoluted folds of the cerebral cortex.
Next, a series of functional MRI (fMRI) scans, which detect blood flow throughout the brain, show brain activity for subjects both at rest and engaged in seven different tasks (including language, working memory, and gambling exercises). The fMRI is souped-up as well: Ugurbil pioneered a technique called multiband imaging that takes snapshots of eight slices of the brain at a time instead of just one.
To complement the data on basic structure and blood flow within the brain, each participant is also scanned using a technique called diffusion MRI, which tracks the movement of water molecules within brain fibers. Because water diffuses more rapidly along the length of the fibers that connect neurons than across them, this technique allows researchers to directly trace connections between sections of the brain. The Connectome team had Siemens customize its top-of-the-line MRI machine to let them alter its magnetic field strength more rapidly and dramatically, which produces clearer images.
Each imaging modality has its limitations, so combining them gives neuroscientists their best view yet of what goes on inside a human brain. First, however, all that neuroimaging data needs to be purged of noise and artifacts, and it needs to be organized into a useful data base. Dan Marcus, director of the Neuroinformatics Research Group at the Washington University School of Medicine, developed the image-processing software that automatically cleans up the images and precisely aligns the scans so that a single “brainordinate” refers to the same point on a diffusion MRI and fMRI scan. That processing is computationally intensive, says Marcus: “For each subject, that code takes about 24 hours to run on our supercomputer.”
Finally, the team adapted open-source image analysis tools to allow researchers to query the database in sophisticated ways. For example, a user can examine a brain simply through its diffusion images or overlay that data on a set of fMRI results.
Some neuroscientists think that all this data will be of limited use. Karl Friston, scientific director of the Wellcome Trust Centre for Neuroimaging, at University College London, applauds the project’s ambition, but he criticizes it for providing a resource “without asking what questions these data and models speak to.” He’d prefer to see money spent on hypothesis-directed brain scans, which can investigate “how a particular connection changes with experimental intervention or disease.”
But the Connectome team thinks the open-ended nature of the data set is an asset, not a weakness. They’re hoping to provoke research questions they never anticipated, and in fields that they know nothing about. “You don’t have to be a neuroscientist to access the data,” says Marcus. “If you’re an engineer or a physicist and want to get into this, you can.”
