Build a Coffee-Can Radar
A quick look at the workings of the DIY coffee-can radar from MIT
Researchers at MIT’s Lincoln Laboratory devised a radar system that any avid DIYer should have no trouble reproducing. This simple radar system provides a basis for courses being taught at MIT and elsewhere. It is capable not only of measuring velocities but also of finding the range to targets. You can even make crude synthetic-aperture radar images with it.
David Schneider: I put the radar signal here on my oscilloscope, I turn it on, and you’ll see the waveform change.
David Schneider: Hi, I’m Dave Schneider for IEEE Spectrum magazine, and this is the MIT coffee-can radar. There may be a few hundred dollars in parts here, but considering that you can use this not only to measure speeds, like a police radar gun, it can actually be used to measure distances very well and even, crudely, as a synthetic-aperture radar.
So we’re out at a local ball field, and we’re going to give the MIT “can-tenna” radar a run here. Got it set up. All I need to do is start recording, and then I’m going to run down the track and back.
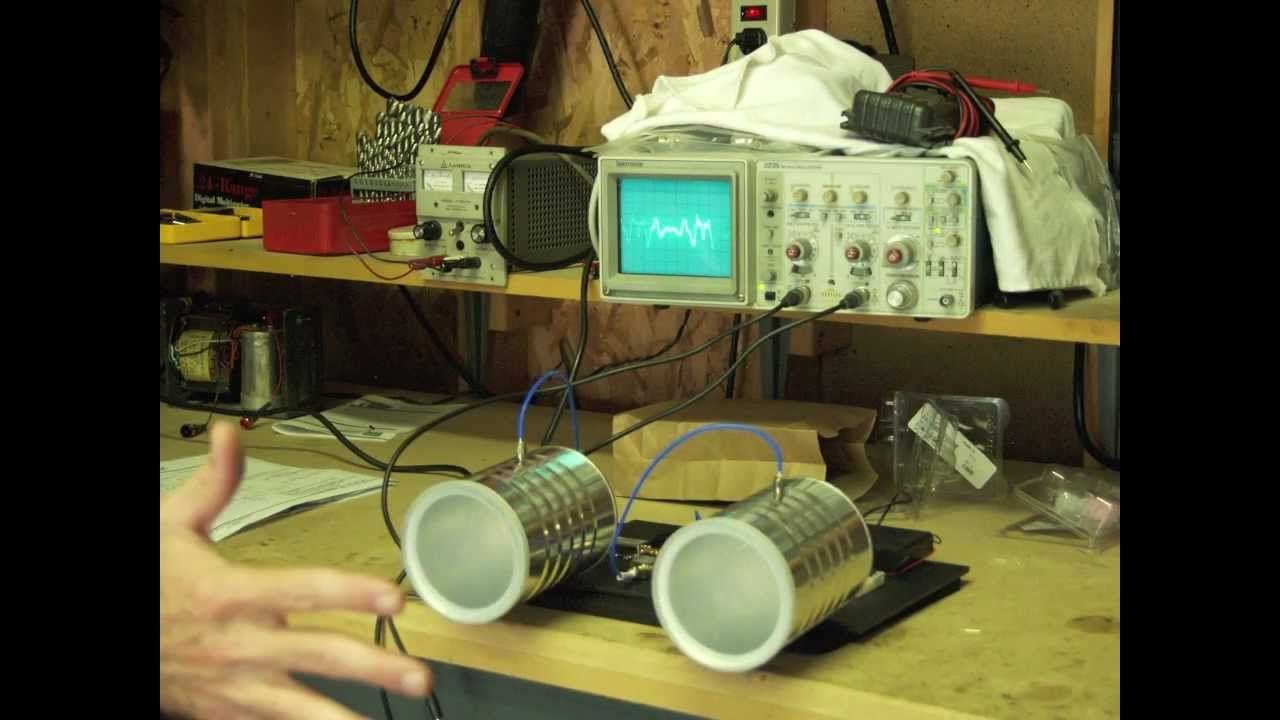
While we’re waiting for my laptop to process the data I just collected, let me give you a little bit of a close-in tour of what’s what.
As you can see, we have a couple of generic coffee cans. Inside the coffee can is just a little wire, and that makes for our radar antenna.
The RF electronics was the easiest to make. It’s these little modules that are just screwed together.
This is a voltage-controlled oscillator. There’s an attenuator here, which you can barely see under these wires, an amplifier here, and a splitter. So part of the signal goes to this antenna, the transmitting antenna, and part of the signal gets fed into this mixer. From the receive antenna, here, a signal goes into another amplifier, is amplified and mixed. It comes through this wire here onto the board, and then the audio comes out and into the microphone inputs and into the Zoom recorder.
I’m going to show you how to process the data now. You need a Matlab script for that. (Actually, in this case it’s an Octave script.) And Octave starts crunching on the data that we just recorded out on the ball field. You can see the results, a range-time-intensity plot. On the horizontal axis, you have range to your target. On the vertical axis we have time, elapsed time, from top to bottom. You see a general vertical grain here, a lot of vertical lines, and those are just reflections from objects that don’t move. But you also notice this reflector here that gets farther away as time goes by, and then disappears and reappears, getting closer as time goes by. Well, that’s me.
There’s a second plot, a little more processing done to cancel out that clutter, those static objects. And you see my reflection much more clearly: going out, turning around, and coming back. And you can see it registers me out to 50 meters or more, which is darn good for a radar system that you build in your garage.
When I turned to try and make a synthetic-aperture radar image, I discovered that I needed a really big target: I ended up going to a big water tower, conveniently across the road from a building that had a nice balcony. It took a little while. You have to move the radar across about 100 inches, moving it about 2 inches at a time while gathering data. But it worked. Like I say, it’s not the most precise SAR image you’ll see, but not bad for a garage project.
For IEEE Spectrum, I’m David Schneider.
NOTE: Transcripts are created for the convenience of our readers and listeners and may not perfectly match their associated interviews and narratives. The authoritative record of IEEE Spectrum’s video programming is the video.
Video: David Schneider, Grace Schneider, and Celia Gorman
David Schneider is a former editor at IEEE Spectrum, and continues to contribute Hands On articles. He holds a bachelor's degree in geology from Yale, a master's in engineering from UC Berkeley, and a doctorate in geology from Columbia.