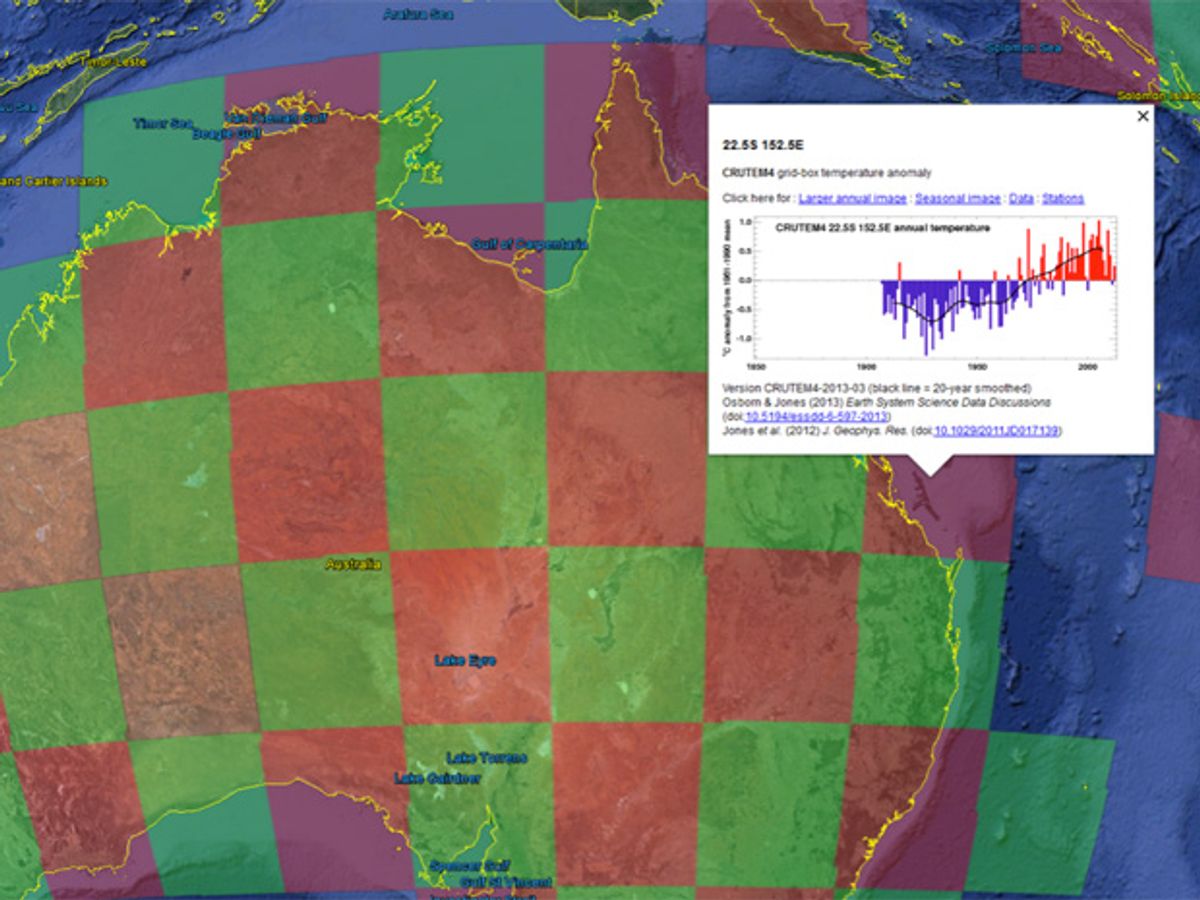
The Climate Research Unit (CRU) of the University of East Anglia has made its worldwide historical record of over-land temperature data available as an overlay on Google Earth. (And non-KML, comma-delimited temperature data files, along with many other kinds of climate records, are available at https://www.cru.uea.ac.uk/data.) The CRU Temperature database, version 4 (CRUTEM4) includes information from some 6000 weather stations, with some time series reaching back to 1850.
The big new data sets may leave some people cold. Others, though, look forward to poring over gigabytes of new information with the glee of Scrooge McDuck diving into a pile of gold doubloons.
The CRUTEM4 Google Earth data is provided in Keyhole Markup Language (KML is named after its developer, Keyhole, Inc., which was acquired by Google). The CRUTEM4 KML schema divides the Earth’s land surface into 780 grid boxes, each 5 degrees latitude by 5 degrees longitude. Users can click any box to see temperature information for that area: options include year-by-year variations (called “anomalies”) from historical means, tracing changes in annual and seasonal average temperature. By default, these consolidated data are “homogenized”—processed to emphasize variations above and below the mean, without noting what that mean temperature might be. The un-normalized temperature data are, however, available at a deeper level: users can drill down to see annual and seasonal temperature data for each individual weather station—like, for example, the station at Krasnaya Polyana, in the mountains near Sochi, Russia, where many Winter Olympics events are now underway.
CRUTEM’s curators, the University of East Anglia’s T.J. Osborn and P.D. Jones, describe CRUTEM and the Google Earth expansion in an Earth Systems Science Data paper. They go into detail on the mechanics and rationale of homogenization—sometimes extensive adjustments needed to compensate for missing data, suspect data, and systematic variations (e.g., changing the method of temperature measurement or moving the measuring station to a different altitude).
CRUTEM4 is the latest in a series of CRUTEM incarnations dating back to 1986. This release, offering increased transparency of the data, may be of particular interest because Osborn and Jones were among the climate researchers embroiled in controversy following the release of stolen CRU e-mails in 2009 and 2011. Widespread accusations, surfacing first among bloggers who resist the idea of climate change, charged climatologists at CRU and elsewhere with trying to derail the peer review process and stifle opposing views. Subsequent investigations by University of East Anglia, Pennsylvania State University, and the House of Commons, among others, largely exonerated the “pro-warming” researchers of wrongdoing, but the brouhaha did succeed in tarnishing reputations of climatologists whose work indicates global warming, and burnishing the rhetoric, if not the substance, of climate-change deniers.
Though there had been speculation that the e-mails had been stolen by a disaffected person inside the University of East Anglia, British police concluded in July 2012, that “the hack was the work of ‘sophisticated’ outsiders, not a whistleblower at the university,” according to The Guardian. Authorities nonetheless closed the case, because, they said, they did “not have a realistic prospect of identifying the offender or offenders and launching criminal proceedings within the time constraints imposed by law.”
Douglas McCormick is a freelance science writer and recovering entrepreneur. He has been chief editor of Nature Biotechnology, Pharmaceutical Technology, and Biotechniques.


