
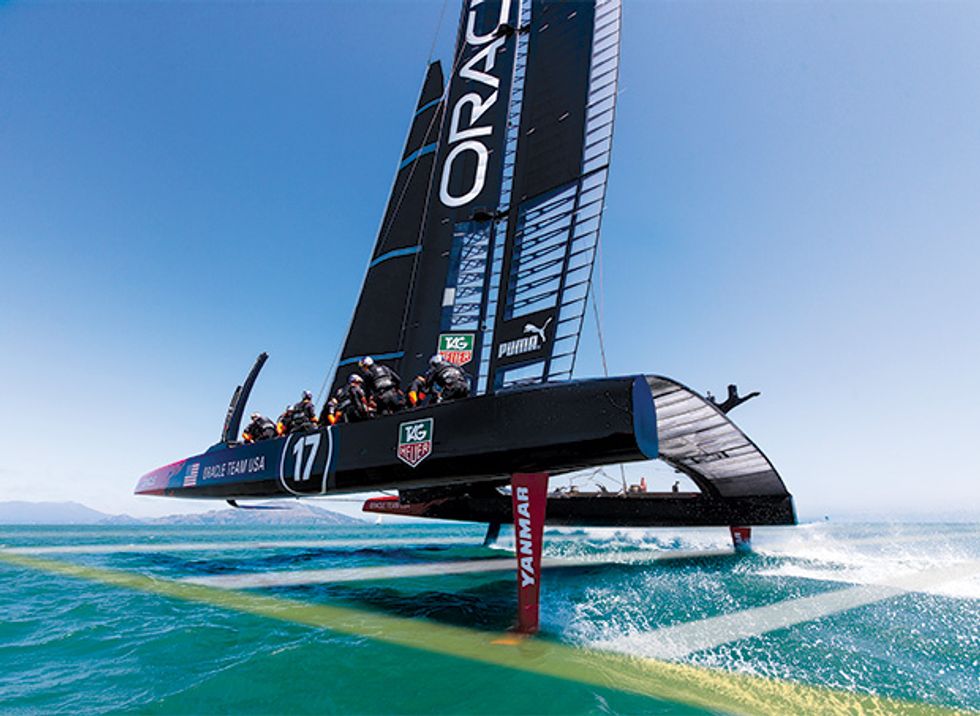
 Boat or Bird? More a wing than a sail, the powerful carbon-fiber airfoil of the Oracle Team USA’s boat speeds it across the water during a training run.Photo: Gilles Martin-Raget/ACEA
As a TV sport, sailboat racing is relegated to the same sorts of channels and time slots as bowling and poker: They’re worse than those for fishing and golf. The problem is that even passionate sailing fans can find it hard to follow races on television, where producers cut back and forth between video of the boats and animated simulations of the action, attempting to show where the boats are in relation to one another. If you’re channel surfing and you come upon a yacht race and have no idea which boat is in the lead, what would you do? Change the channel, probably.
That’s a shame, because sailboat racing is as thrilling, dynamic, and suspenseful as any sport around—if you’re down there on the water with the boats, that is. And starting with the 2013 America’s Cup, to be held this month in San Francisco, you will be there, virtually speaking. You’ll be able to monitor the events live on TV and on your mobile devices. You’ll see the spray flying off the bow of a big racing catamaran as its crew scrambles to make high-speed maneuvers in a stiff wind. You’ll see the world’s top sailors grappling to control powerful vessels driven by sail-like vertical wings, 12 stories high. You’ll also see perspectives and information never before available to spectators: the tracks of the boats through the water, course boundaries, penalties issued, wind direction, speed, and other things that significantly affect the outcome of the race.
Automatic tracking systems on each yacht will constantly feed position data to high-performance PCs on shore. Custom-built augmented-reality software will turn the position data into informative onscreen graphics in real time. The graphics will look as if they’re painted on the water—essentially, a streaming “chalk talk” of race progress. Audio and video streams from the boats, virtual course marks “drawn” in real time on the televised water, and computer-controlled cameras on helicopters will all contribute to the viewing experience for those in front of televisions at home or standing near giant screens onshore.
Whether or not the technology succeeds in its goal of bringing millions of new fans into the sport of elite sailing, it will change the race itself. For the first time, race umpires will be able to consult live computer-rendered diagrams showing boats and the location of different course markings before ruling on a possible rules violation, in much the same way that referees in American football now use instant replay—except America’s Cup umpires will look at the images before making their calls.
The America’s Cup tradition started in 1851, when a boat named America won a race around the Isle of Wight in England. The winning team named its trophy the America’s Cup and donated it to the New York Yacht Club. The race has occurred every four to five years since, with a few longer and shorter intervals, and it is always between the current holder of the cup—the “defender”—and a single challenger. Since 1983, that challenger has been determined before each match in the Louis Vuitton Cup race series, in which national teams compete for the right to challenge.
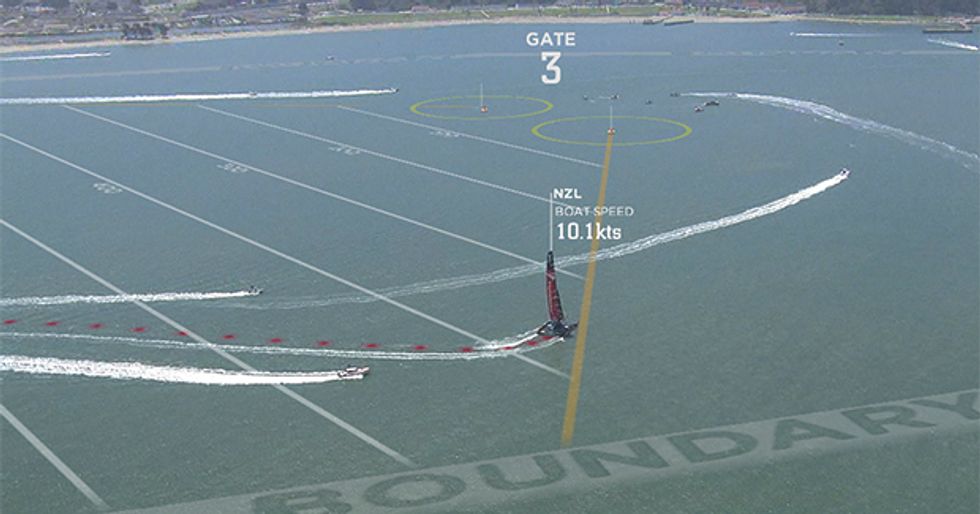 On the Water: The AC Liveline system inserts graphics into the live television feed of a sailing race, using video shot from helicopters and position data sent directly from the boats. Lines 100 meters apart span the course, creating a “ladder” that leads to the next gate or mark at which the boats must make a turn; this allows viewers to easily see which boat is ahead. Yellow polygons identify the area around the buoys that mark the required turns; for the sailing-savvy viewer, knowing this region is important because certain special race rules go into effect within it. Yellow lines indicate laylines, the places where the direction of the wind will allow a boat to sail in a straight line to the next gate. The white text that appears to hover in the sky calls out the gates through which boats must pass; it also identifies the boats, their speeds, and other information.Image: ACEA
Although it is among the oldest of sporting events, the America’s Cup has embraced change far more quickly than other major sports, because each winning team takes over not just the trophy but the event itself. It can change the venue and type of boat, redefine the course, and completely rewrite the rules for the competition, with the agreement of the challenger. For example, racers used enormous and costly J-class yachts, typically about 38 meters in length, in the 1930s, then switched to the smaller and cheaper 12-meter class of boats, typically about 20 meters long, after World War II.
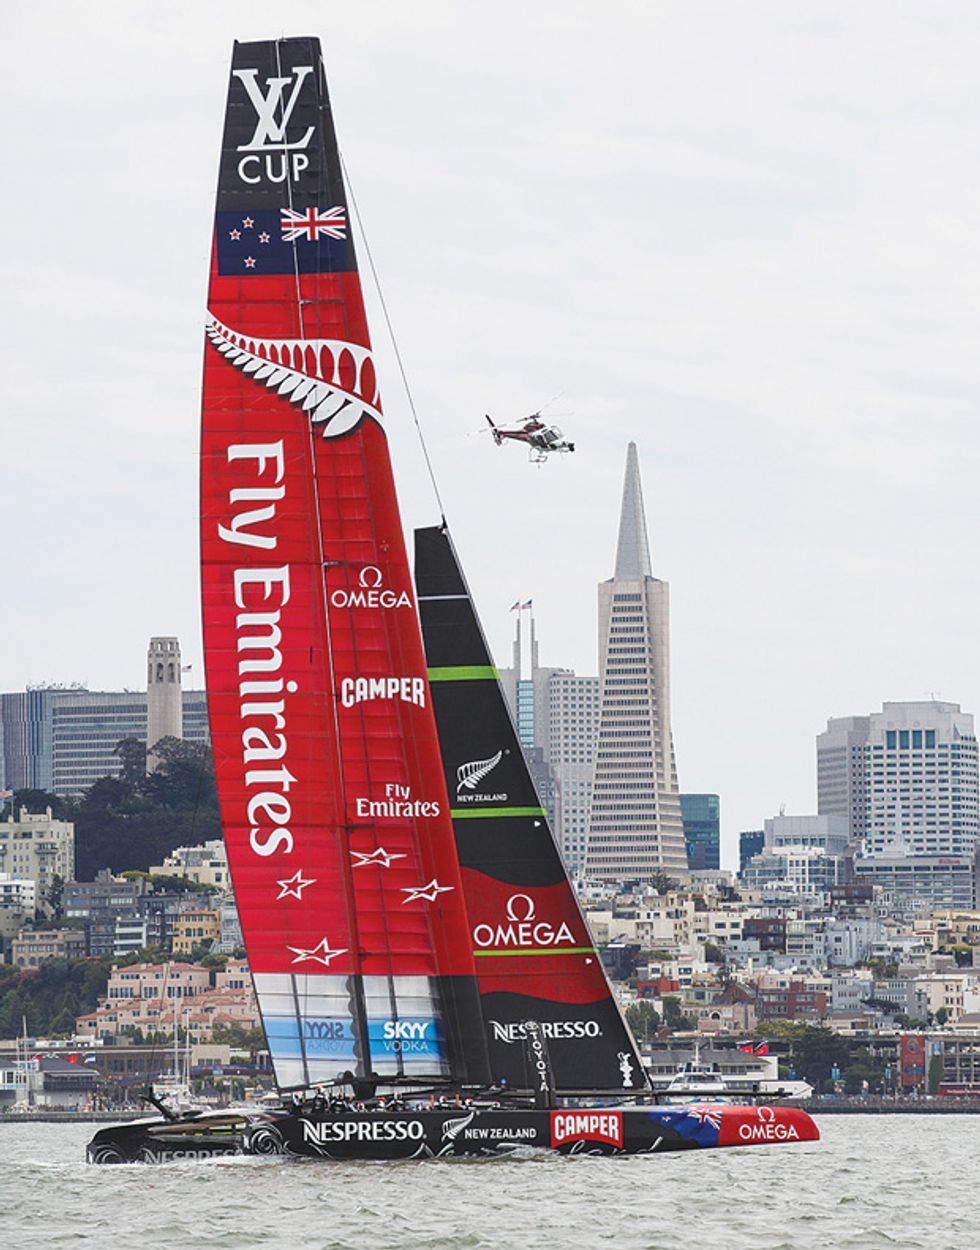
In this year’s contest, Oracle Team USA, founded by software billionaire Larry Ellison, is the defender of the America’s Cup. (As of mid-July, the challenge races among teams from Italy, New Zealand, and Sweden were under way.) A brash entrepreneur whose database company disrupted business computing in the 1980s and who is today the head of the world’s third-largest software vendor (behind only Microsoft and IBM), Ellison isn’t shy about betting big on new technologies. So it’s no surprise that Ellison’s America’s Cup defense will introduce the most radical changes ever.
To begin with, consider the boats chosen for the competition: They are 22-meter (72-foot) catamarans, the highest-performance, most technology-laden, most innovative boats ever sailed in the America’s Cup. They can reach speeds of about 45 knots, and each one costs about US $8 million—a price tag that has kept the field of challengers unusually small. The boats are built largely from carbon fiber, a material more common in aircraft than in yachts. The designers eschewed the usual fabric mainsails for “wing masts,” which are stiff structures shaped like airplane wings. The controversy over these boats, which sacrifice some stability for speed, came to a head last May, when a veteran British sailor from Sweden’s Artemis Racing team was killed after his boat “pitch-poled”—that is, it flipped end over end—and suffered a structural failure during a training run. The accident followed another, nonfatal one in October 2012, when one of the Oracle team’s boats pitch-poled, destroying its wing sail, not far from the Golden Gate Bridge. Not just the yachts but also the racecourse will be unusual. Instead of sailing well offshore, out of the view of spectators, the boats will sail on short courses in the San Francisco Bay, quite close to the shoreline.
In June 2010, the Oracle team hired the two of us to develop the tracking, telemetry, and augmented-reality system for the races. We are both electrical engineers, and one of us (Honey) is a professional sailor who competes in elite races. We have a long history in applying augmented reality to broadcast sports. Our past projects include the yellow first-down line now ubiquitous in televised American football, the tracking system now used in NASCAR and other motor races, and the ESPN K Zone system used to track and show a baseball’s path in the vicinity of the strike zone.
What these systems have in common is that they all highlight a location, path, or movement that is important to the sport and yet was previously invisible—or at least hard to see—on television. In American football, for example, the objective of most plays is to get (or prevent) a first down, which is achieved by moving the ball 10 yards down the field within four plays. Before we developed our system, the only indication of the down line was an official holding a pole at the edge of the field. If you were watching the event on TV and the TV camera happened to zoom in on the play, you could no longer see the man with the pole. To solve this problem, we inserted a yellow line into the live video; to TV viewers, the line appears to run across the width of the field, apparently underneath the athletes, making the distance to the first down obvious at all times.
But with sailing we were facing a much more difficult challenge. In sailing, almost everything that goes on is hard to see. Never mind the nuances of the sport; just telling who is in the lead is often difficult without onscreen graphics. Like a skier on a slalom course, a boat must pass through a series of gates or around “marks,” which are designated with buoys. But that’s about all that’s visible. Take wind direction, a crucial piece of information for appreciating a sailing race. While spectators onshore can roughly tell the wind direction, those watching on TV can’t do much more than guess.
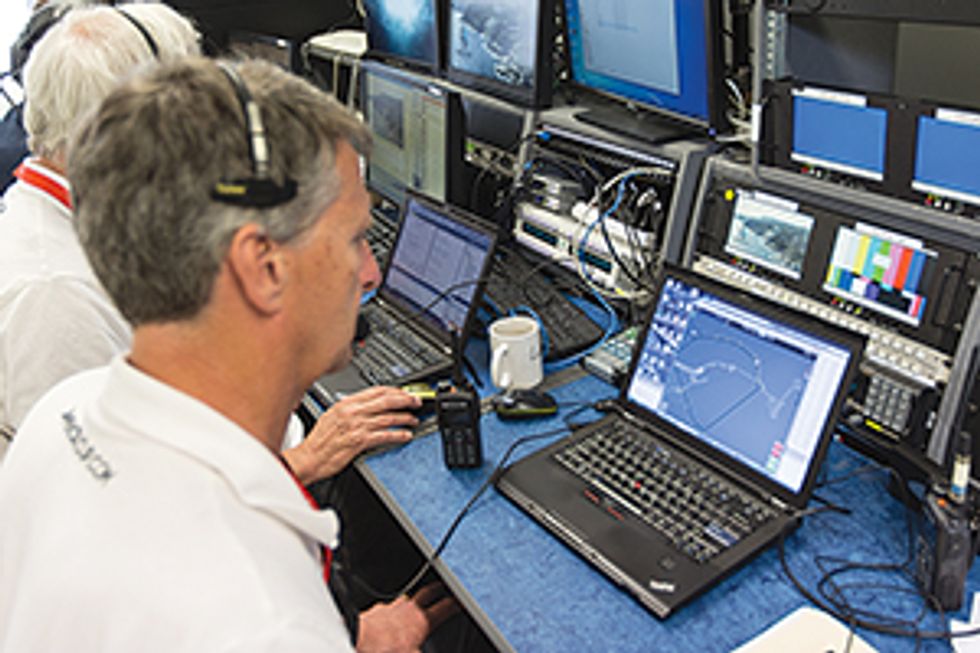
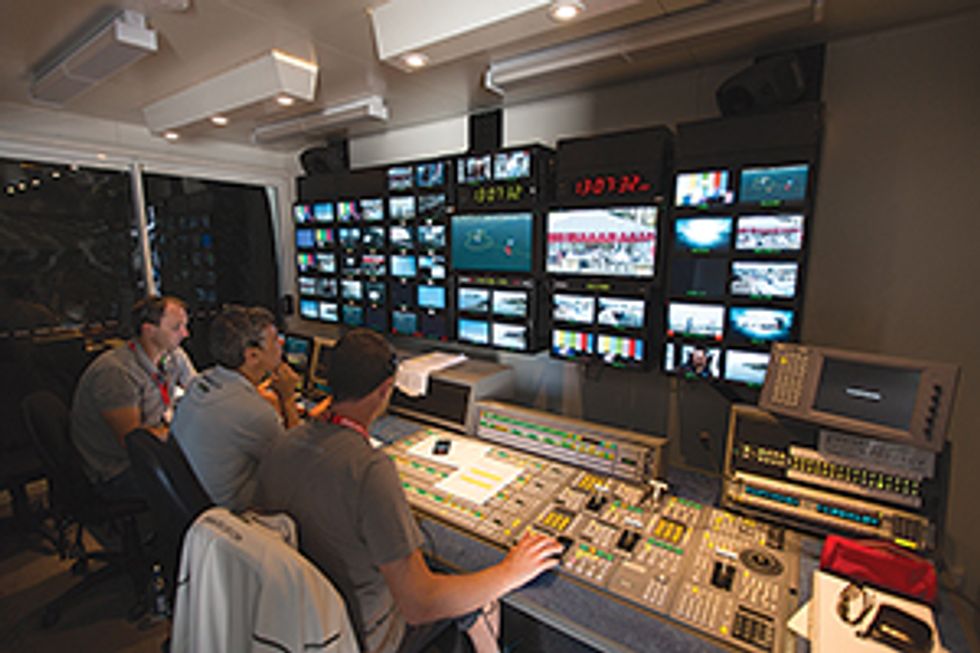 Sea of Data: Video feeds and position information (diagram, top) travel from boats and helicopters (right) to AC Liveline’s headquarters. In that facility, shown here in 2013 during the America’s Cup World Series held in Naples, Italy (center), they merge into an augmented video stream that can be broadcast live. In the broadcast production room (bottom) the show director selects from a variety of video feeds, including the Liveline augmented feed.Illustration: Emily Cooper; Photos: Ricardo Pinto/ACEA(2)
Racecourses typically run parallel to the direction of the wind, but sailboats can’t sail in a straight line directly into the wind, and sailing directly away from the wind is inefficient. So sailors must position the boat so the wind comes over the side of the boat at an angle and fills the sails to propel the boat forward. To do this, the crew follows a zigzag path, alternating between turning upwind (tacking) and downwind (jibing). In other words, when a boat is tacking, the sailors are turning it into and through the wind, which causes the sail to move from one side of the boat to the other. Confusing? For TV viewers, it is doubly so: Not knowing the wind’s direction makes it tough to figure out where a boat is attempting to go or why it’s doing what it’s doing.
Other elements typically lost to viewers include the course’s outer boundary and, crucially, the laylines. The laylines are imaginary lines that show the points from which the wind’s angle allows a boat to set a straight-line course, without additional tacks or jibes, directly to the next gate—one of the many pairs of buoys that mark the twists and turns of the course. Knowing just the location of the gates doesn’t tell a viewer much about race progress, because until a boat gets to a layline, it doesn’t aim for the gate; instead it is tacking or jibing and may at times appear to be traveling perpendicular to a gate. For the 2013 America’s Cup, all these lines, directions, and subtleties will be revealed to television viewers directly and in real time. In place of the graphical inserts or separate animations that were used to explain the action in the most recent broadcasts, the visual cues will be integrated right into the action.
Making a sailing race as easy to follow as a football game starts with defining the playing field. On the live video, we’re superimposing lines that delineate the course boundaries along with a “ladder” of 100-meter lines. If two boats are on the same “rung” of the ladder, they have the same upwind or downwind distance to sail to the next buoy-marked gate or mark. With these lines as guidance, even a viewer new to sailing can quickly see which boat is in the lead. We’re also marking an area extending three boat lengths out from each gate with a yellow polygon. When boats enter this yellow zone, race rules aimed at defining which boat has the right of way determine which boat can take the shorter, inside turn through a gate. That’s why we’re identifying the entire zone, not just the gate itself.
In addition to the ladder with numerical meter markings and the yellow gate zones, we’re displaying laylines in yellow, boat tracks in a variety of colors, wind direction as an arrow on a compass, and text blocks that travel with the boats, spelling out such information as the boat’s name and speed. At a glance, a viewer will be able to tell not only which boat is in the lead but also by how much, whether and how fast another boat is gaining on the lead boat, and whether competitors are taking similar or different approaches to the next gate.
Not all of these graphic elements are new. Starting with the 1992 America’s Cup, broadcasts used virtual-reality graphics systems called SailTrack and Virtual Eye. These displayed laylines and other information as part of an animated rendering of the race action—but they were not superimposed on the live video of the race itself. As the TV broadcast toggled back and forth between the animation and the live video feed, commentators struggled to explain the similarities and differences to viewers. As a result, the race broadcasts were sometimes fragmented and confusing.
Augmented reality is far easier to interpret and vastly more interesting to watch than animation because viewers get to see all the information they need at once. They see the real boats, the sailors themselves, and the wind’s effects on the water. But to combine graphics and live video seamlessly has required some serious engineering, involving integrating sensors, telemetry systems, and custom-written software. We call it AC Liveline.
To track a sailing race, we have to measure each boat’s position automatically and accurately, updating the measurements continuously. Conventional GPS receivers, which at best can calculate a position within a meter and can occasionally lose track of their locations, aren’t good enough for what we need; we want to make our graphics look like they’re part of the race itself. If we tag a boat with a supplemental graphic, it must appear to travel smoothly with that boat. And if our tracking is accurate to only 1 meter, then when a boat enters a gate zone half a meter ahead of a competitor, we won’t actually know which one got there first, and umpires wouldn’t be able to use the data. So we had to develop a system that could reliably give us location data to within 2 centimeters.
In order to position our graphics properly and make them appear to move with the boats, we also need to measure the direction in which the boat is pointing (the heading), the front-to-back tilt (the pitch), and the side-to-side heel (the roll) of each boat to within 0.1 degree. We also need to know the heading, pitch, and roll of the TV camera that’s up on a helicopter capturing the overhead view of the race, because we’re synchronizing this video with the position data from the boats. Because the zoom lens on that camera would magnify any misalignment, we need to measure its angle with a higher accuracy—to within 0.01 degree—than is needed for the angles of the boats. Any lesser accuracy would mean we’d risk displaying a graphic that appears to be meters away from the corresponding boat. The 2-cm and 0.1-degree levels of position and orientation accuracy for the race yachts let umpires and race managers use our system to help run and officiate races.
Getting the position data down to 2-cm accuracy was tough. We started with a superior kind of GPS receiver that monitors the so-called carrier signals. This isn’t the standard GPS receiver found in your car, phone, or athletic-training wristwatch. In those receivers, both the receivers and the GPS satellites simultaneously produce identical strings of digital code. Each receiver then compares the code it received from the satellite with the code it generated. Because of the time it takes the GPS signal to travel from the satellite to the receiver, these strings of code will be slightly out of sync; the receiver looks at the relative timing of the signals from four or more satellites and uses those measurements to calculate its distance from each satellite and its own position on Earth.
But to get even greater precision using the same type of analysis of the signal timing, you need to look at something with a shorter wavelength. That something is the RF carrier on which the code travels. The code itself repeats every 1023 bits, which takes a millisecond, giving it a frequency of about 1 megahertz. The carrier signals, however, are transmitting at frequencies of 1.2 and 1.6 gigahertz. The upshot is that a GPS receiver looking at carrier cycles in addition to the code can determine its position to 2 cm.
 The Challenger: Team New Zealand won the 2013 Louis Vuitton Cup and the right to sail against Oracle Team USA for the 2013 America’s Cup.Photo: Abner Kingman/ACEA
Achieving 2-cm accuracy requires one more thing. We’ve added a base station onshore; we surveyed the spot and identified its precise location. Because the reference GPS receiver at our base station knows exactly where it is, it can estimate the effects of atmospheric conditions that cause signal delays. It can then calculate corrections for those delays and send them to the GPS receivers on the boats; those corrections are necessary to get that 2-cm position accuracy.
There are currently 31 satellites operating as part of the GPS system; a receiver typically needs to be able to receive transmissions from four of them in order to pinpoint its location. On occasion, a boat’s own carbon wing or the wing of a nearby boat blocks so many satellites that we lose the ability to track its position via GPS. That, for us, would be a disaster. So we needed yet another backup plan. We selected an off-the-shelf navigation system that couples GPS with the inertial navigation system. An INS uses inertial sensors to implement the most basic navigational scheme there is: dead reckoning. The system has internal accelerometers and gyroscopes that constantly measure linear and rotational movement and direction; it also has an onboard processor to calculate navigation information using that data. With an INS on board, the crew no longer need compasses, but they carry them anyway.
Back onshore, a computer system takes all the position data from the boats and the helicopter—also outfitted with our augmented GPS-INS system—along with the video feed from the camera and matches every location in the real world to a pixel in the camera image. This enables us to place the laylines and the tags identifying the boats and their speeds precisely into the image so that it looks realistic to the viewer.
An enormous amount of calculation is necessary to make that happen. But it’s based on some of the most basic principles of fine art. If you’ve ever taken a basic art class, you’ve studied perspective. First, you pick a “vanishing point” at what will be a distant place in your drawing. To position an object in the scene, you draw straight lines from the front of the object to the vanishing point, and then align the rest of the object along those lines.
Here, we’ve turned that around. Our single distant point is the camera. It corresponds, if you will, to the vanishing point—in this case called the point of view. Our system takes all the pixels in the image and calculates imaginary lines that connect each pixel to the camera. Now, say we want to put a boat’s name near the boat. We rely on the position data to identify the correct object—the boat—and then use those calculated perspective lines to position the name in relation to the boat so it appears integrated into the scene in a visually pleasing way.
In addition to the data needed for the augmented-reality system, we’re streaming 80 megabits per second of video from up to four of the seven HDTV cameras mounted on each boat, and we’re sending signals from shore that allow cameramen to remotely adjust each camera’s pan, tilt, zoom, and focus. We also send about 500 kilobits per second of data to and from the boats, including things like race boat locations, course boundary changes, locations of course marks, and penalties, and about 150 kb/s to and from the helicopter. We’ll be sending data in a section of the 2-GHz band that we licensed for this purpose, using a modulation technique called coded orthogonal frequency-division multiplexing. COFDM spreads a digital transmission across multiple subfrequencies within the allocated frequency band; it’s the way digital broadcast television works in most of Europe. It is also the modulation system used in one of the most advanced Wi-Fi standards, IEEE 802.11n. But we’re using a time-slotted protocol, which is different from conventional Wi-Fi.
Typically, today’s Wi-Fi and Ethernet systems detect in real time when a data packet runs into interference from another data packet sent from another user; the first transmitter then waits a random amount of time and resends the packet. This method is often called carrier sense multiple access with collision detection, or CSMA/CD. In time-slotted protocols, transmissions aren’t random but rather scheduled to take turns using the channel. Time-slotted protocols are an older approach that isn’t used widely today because they’re less flexible and, in cases of unpredictable channel usage, less efficient. But in our case, with steady data rates, time-slotted techniques avoid collisions and we end up gaining in efficiency.
We send the video separately on licensed frequencies in the 3-GHz band. There are up to 14 HD video signals coming from the racing yachts, chase boats, various official boats, and helicopters, and each of those HD signals will be compressed from 1500 down to a range from 5 to 10 Mb/s and transmitted using COFDM.
The magic really happens when we combine the position information from sensors on board the boats with the video and camera position data from the helicopter. Viewers will be able to see not only tiny boats inching along the TV screen but also lines, shapes, and other graphics that appear to be painted on the rolling water.
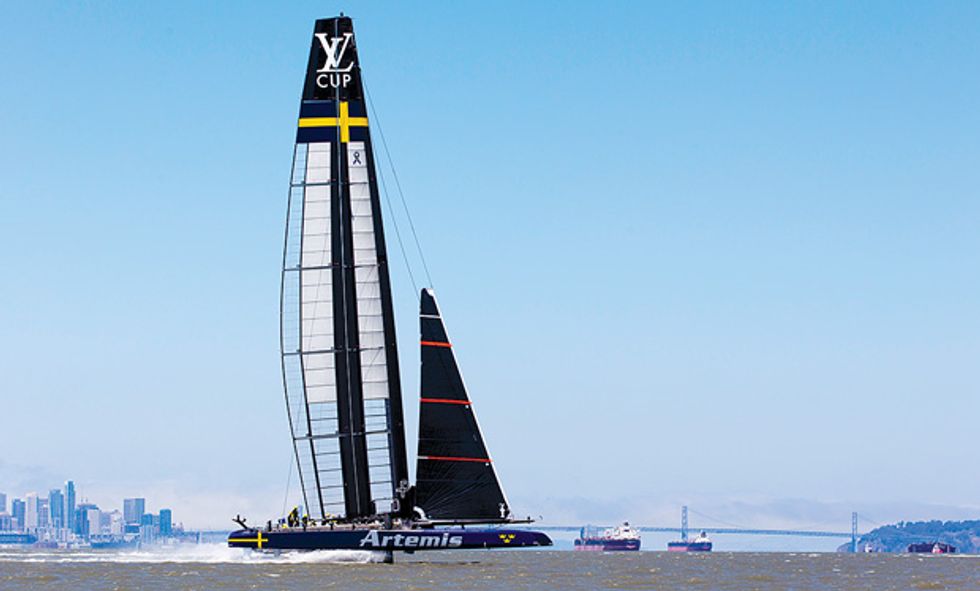 On the Bay: The Artemis racing team, from Sweden, practices on San Francisco Bay in July, in preparation for the 2013 America’s cup.Photo: Sander van der Borch/Artemis Racing
Creating this illusion starts with putting a time stamp on each frame of the video as it is shot; we’ll also be time-stamping the position data from the race boats. We’ll use a high-speed PC with a specialized video capture card to bring graphics based on the position data and live video together in a composite image, synchronized by time codes. Our system will then feed the composite image to the television production room, where it will join 19 other live video feeds. There, the director will select the shots that will go out in a single video stream to NBC, the lead broadcaster for the race, and to 30-plus other broadcasters around the world. The whole process delays the live television display of the race less than a second.
One of the challenges is making the graphics look as if they were lying on the water’s surface, so that the boats appear to sail over the colored lines and not under them. For this we use a common television technique called chroma keying. You see it in use whenever you watch a TV weather forecaster standing in front of a map; in reality, the forecaster is standing in front of a blue or green screen. A typical green-screen chroma keyer detects where the image is green, and that’s where it “draws” the weather map image; otherwise, it draws the foreground image of the newscaster. Boats sailing on an ocean don’t have a reliably consistent background—the water’s appearance can vary depending on the weather and the direction of the sun. So the AC Liveline system uses a specialized chroma keyer that allows a wide range of background colors; an operator manually picks the correct water color by clicking a mouse over an image of that water.
Not only is our AC Liveline System changing how TV viewers see the race, it is also triggering changes in the sport itself.
Televised sports like NASCAR and Major League Baseball already gather extensive data from tracking systems to enhance the live TV broadcasts. Yet rarely is the tracking data used for officiating the event; umpires still call the balls and strikes in baseball, even though the tracking system could probably do the job more accurately. But in the America’s Cup race, the same technology that will help viewers appreciate the race also helps officials make their calls.
Race officials will use the AC Liveline system in a few ways. For the first time, there will be two sets of race umpires: One set will be in boats on the water, as is traditional; the other set of umpires will sit in a booth onshore, watching real-time diagrams of the race action generated by AC Liveline and displayed on large screens.
The booth umpires will make the objective calls that come from knowing boat locations and orientation; for example, they can tell if a boat prematurely starts or sails beyond a boundary. They can also see the position of a competitor’s boat when a boat first touches the zone around a mark; in certain situations, an inside boat has the right to round the mark inside the curved path of the other boat, even if it didn’t enter the mark zone first. The umpires on the water will make subjective judgment calls that include deciding whether a collision was avoidable—that is, determining if the helmsman of one boat gave the other room and opportunity to maneuver to avoid the collision.
This 2013 America’s Cup is breaking with tradition in one more way: The organizers are making all the data collected publicly available. This open-data policy makes sense in today’s Internet world: The basic raw data, including the real-time position of the boats, and race management data such as boundaries and penalties, will be streamed free of charge to the general public as it is being collected during the racing events. Various companies are developing smartphone and tablet apps to exploit the data. Some of these apps are intended primarily for use by fans at the event so they can view live data about the race, such as the time or distance between boats, or listen to onboard audio from a selected boat. Other apps generate a virtual-reality display of race action for those not on-site. The apps announced to date include the official America’s Cup Mobile Application and CupExperience.
The teams onshore will have access to the data as well, although the sailors on the water will not. In previous America’s Cup races, teams were carefully prevented from getting their hands on any detailed data from the media systems, but the teams worried that some competitor might figure out a way to break into the system and gain an advantage. By making the data publicly available, we essentially made this problem vanish: All the teams are satisfied that they are fairly and evenly treated, because all the data is equally available to all the team members onshore. The sailors aboard the boats will have access only to specific data feeds, giving them their own position and information about the boundaries and the course. The teams have developed proprietary systems to analyze and display this data to the sailors on board.
We hope the technology we’ve developed for this summer’s America’s Cup will eventually trickle down to all televised sailing. We also hope that the umpiring and race management tools will become widely used and will permit all high-level national, world, and Olympic competitions to be run more efficiently and be judged more fairly and openly. And we expect that the tools for graphically augmenting video will be applied to other sports that are also typically shot from aerial cameras, such as long-distance car racing, bicycle racing, marathons, and triathlons.
But that’s in the future. In the meantime, the battle for the America’s Cup is under way in San Francisco and being broadcast around the world. If you watch any or all of the races this month, you’ll be part of history. You’ll be seeing the very first sailing race designed to appeal to the lay viewer. And someday soon, when you tune in to a boat race at home or at a local sports bar, you may wonder why sailing wasn’t always as popular as soccer or football.
This article originally appeared in print as “The Annotated America’s Cup.”
About the Authors
Coauthors Stan Honey and Ken Milnes have worked together for decades. Today, Honey is director of technology for the America’s Cup Event Authority and Milnes is live graphics product manager for the organization; they helped develop the broadcast wizardry behind the streaming “chalk talk” of this year’s races. In 1983 the two cofounded Etak, a pioneer in car navigation systems. In 1998 Honey founded Sportvision, creator of the yellow first-down line used in American football broadcasts. Milnes joined him there, serving as lead engineer on RACEf/x, a tracking system for motor sports broadcasts. These engineers also share a passion for boats; Honey is a professional navigator for long-distance sailing [see Back Story], and Milnes, an amateur sailor since childhood, recently built a very low-tech boat—a wooden kayak.