The Conversation (0)

At The Epidemic’s Epicenter: A Liberian child sits in an Ebola isolation ward housing people who might have contracted the contagious disease.
Photo: John Moore/Getty Images
Here’s what we know for sure. On the afternoon of Friday, 3 October 2014, Pyrros A. Telionis got a telephone call from the U.S. government’s Defense Threat Reduction Agency (DTRA). He was sitting in a featureless cubicle in Blacksburg, Va., that would have made the cartoon office drudge Dilbert feel right at home. The voice on the phone was brisk and professional. And highly specific. Could Telionis provide, by 8 o’clock Monday morning, a list of the best places to build Ebola treatment centers in Liberia’s six southernmost counties?
![]()
At first glance Telionis, a Ph.D. student in computational biology at Virginia Tech, might not seem the obvious person to advise the Department of Defense, which was preparing to send about 3,000 people to West Africa to help combat the worst outbreak of Ebola virus the world has ever seen. The military personnel planned to build Ebola treatment centers, mobile labs, and a hospital for infected health care workers.
The Pathogen
![]()
Telionis did, however, bring hidden strengths to the Defense Department’s urgent assignment. Behind him was the expertise and computing power of the Network Dynamics and Simulation Science Laboratory, which is part of the 250-person Virginia Bioinformatics Institute. Split between Virginia Tech’s Blacksburg campus in rural southwest Virginia and an office building near Washington, D.C., the lab has done epidemic modeling for the Pentagon for nine years. Just that week, Telionis had run an experimental program he’d written to determine the best locations for Ebola treatment centers in a few Liberian counties. DTRA was impressed by the exercise, and now the agency wanted him to do it for real.
First, Telionis had a decision to make. It was the last day to drop classes at Virginia Tech without penalty. He abandoned Advanced Methods of Regression Analysis and spent the next 64 hours working for DTRA.
His research was part of the lab’s ambitious efforts to represent, through mathematical equations, the evolution of a deadly epidemic. Ideally, such models should be able to predict how quickly a disease will spread, who is most at risk, and where the hot spots will be, enabling public health authorities to take steps that diminish or shorten the epidemic. Those calculations require vast amounts of information, not only about a disease’s behavior but also about a population’s.
To find the optimal locations for six Ebola treatment centers, Telionis’s computer model sought to minimize the distance an infected person anywhere in the six-county area would have to travel for treatment. Each center had to be on a road confirmed to exist—not easy information to come by in poorly mapped Liberia. But Telionis, working with a fellow grad student, James Schlitt, had found a list of such roads on the Web the week before. He was less certain about the distribution of the six counties’ populations, so he used two estimates: one from Oak Ridge National Laboratory (LandScan), the other from a consortium of European and American universities (WorldPop). He was also terrified that the program he’d written for the earlier exercise might have an overlooked bug. So he asked Schlitt to write an entirely new one, in a few hours, using different software. “People’s lives were on the line,” Telionis recalls months later. “We were actually pretty nervous the whole weekend.”
The two students barely slept, but they delivered their 19-page product—including maps, tables, and animations—at 6:26 a.m. on Monday. They beat their deadline by an hour and a half.
Did the Virginia Tech models make a difference to the Ebola response? We may never know for sure. The map of the treatment centers that the Defense Department built certainly looks a lot like the one that Telionis and Schlitt turned in. Beyond that, it’s impossible to say, because Defense Department officials won’t comment.
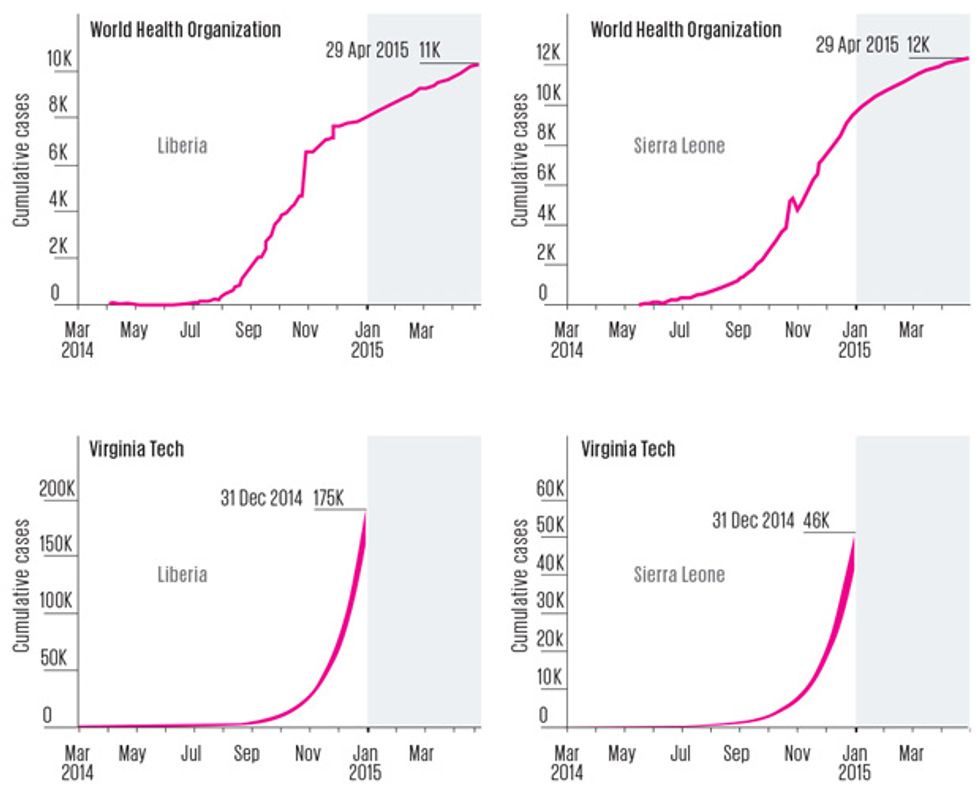 The Problem With Prophecy: The Virginia Tech modelers produced their forecasts (bottom row) for the Ebola epidemic’s course in Liberia and Sierra Leone in October 2014 based on data from preceding months, when the number of people infected by the virus was growing exponentially. Their forecasts, and those of many other modelers, vastly overpredicted the actual toll of the disease. As of May 2015, the World Health Organization’s record (top row) put the cumulative total of Ebola cases at 10,564 for Liberia and 12,440 for Sierra Leone.Data Sources: World Health Organization; Virginia Bioinformatics Institute, Virginia Tech
The same uncertainty surrounds the weekly forecasts other Virginia Tech modelers gave to the DTRA from August 2014 through February 2015, which included predictions of the epidemic’s likely course and estimates of how various interventions might change it. DTRA officials say the work was “actually useful,” but they won’t provide details. People at the Pentagon, the U.S. Centers for Disease Control and Prevention (CDC), and the U.S. Department of Health and Human Services will speak of the modeling’s utility only in general terms.
The researchers who were desperately crunching the numbers during the outbreak say that real-time epidemic modeling, done for policymakers since the 2003 SARS outbreak, got its harshest test with Ebola. For the most affected countries—Guinea, Liberia, and Sierra Leone—much of the data used to generate epidemic models was missing, old, or unreliable. That included information on population, household size, daily activities, travel patterns, and the condition and even the existence of roads. Data on key disease-specific variables, such as new cases per week and time from symptom onset to hospitalization, was also spotty for much of the outbreak. There was also a complicating factor not seen in most epidemics: Traditional West African burial practices, in which untrained people often wash and touch the dead, could act as “superspreader” events.
By the Numbers
The Hot Zone
As a consequence, modelers had a hard time answering the most important question: How bad will this get? Some wildly inaccurate forecasts prompted media criticism, which in turn drew defensive responses. A letter in November 2014 to the journal Nature signed by 24 workers from various modeling teams was headlined “Ebola: Models Do More Than Forecast.”
Now, with the Ebola gone from Liberia and tamped down in the other two countries, the global health community is taking stock of the role of epidemic modeling in its response. In late March of this year, the National Institutes of Health held a closed-door meeting of modelers to discuss why so many predictions were off. Christopher Dye, director of strategy for the World Health Organization (WHO) and an epidemiologist, said recently, “If you take modeling out of the response to this epidemic, would it have made any difference? I would say very little.”
Others were more sanguine. Modeling “had a substantial effect,” says Matthew Hepburn, an infectious diseases physician at the Defense Advance Research Projects Agency. “It really set off alarm bells.” Richard Hatchett, chief medical officer of the U.S. government’s Biomedical Advanced Research and Development Authority, thinks modeling’s usefulness lies in its ability to help organize thinking. His office hosted a weekly teleconference of modelers, which sometimes involved 100 people from two dozen institutions. “What decision makers are most interested in is what risks they’re facing,” he said. “They turn to modeling to help them understand risk—the high side and the low side—and the likely impact of a set of interventions.”
In their mathematical struggle against a highly infectious virus that tore through West Africa, modelers were up against a challenge the likes of which they had never seen. But it’s worth asking: In the fray, did they learn enough to make such tools a realistic hope for the next epidemic?
The most recent Ebola outbreak began in Guinea in December 2013. By March it had spread to neighboring Liberia and soon entered crowded cities that had never before experienced Ebola’s ravages. Yet it wasn’t until 8 August 2014 that the WHO declared a “public health emergency of international concern.” The world was playing catch-up from the start, and so were the modelers.
Virginia Tech graduate student Caitlin Rivers, who was finishing her doctorate in computational epidemiology, was one of those running the race. When her advisor, Bryan Lewis, asked her to turn her attention to Ebola in July, she started with a model built from the data of a 1995 outbreak in Central Africa and published by a French scientist in 2007.
That model partitioned the population into categories: susceptible, exposed, infectious, hospitalized, dead but not yet buried, and those no longer capable of virus transmission because of burial or recovery. It considered everyone, from infants to the elderly, to be at equal risk of infection and assumed the disease would move through a population in a homogeneous fashion. In other words, it was a gross oversimplification, especially for a complex pathogen like the Ebola virus. But it was better than nothing.
To sharpen her model, Rivers knew she needed this outbreak’s case counts per day or week. These are essential for building an epidemic curve, which visually depicts the growth of an outbreak over time. Rivers searched the Web and found that the Liberia and Sierra Leone governments published reports (sporadically, but sometimes twice a day) listing the numbers of new cases, cases in treatment, contacts being sought, and contacts found. The data was in PDF form, so she did the “very unglamorous work” of transcribing it onto a machine-readable spreadsheet. She knew other researchers would be interested, so she posted it on GitHub, a website for open-source data. By October, her database was getting 2,000 visits a day.
Once Rivers and Lewis had four weeks of data in hand, they cranked the first curve out of the model. “It showed exponential growth,” Rivers recalls. “Which is really the last thing you want to see in an outbreak.”
The data Rivers compiled didn’t include some information essential for forecasting, such as the length of time from exposure to infectiousness and the duration of infectiousness. Some modelers used values measured in previous Ebola outbreaks, but Rivers doubted that historical data would apply to the current scenario. So she had her computer program estimate those values based on what the epidemic curve was showing. It was a good strategy; her values turned out to be close to the actual ones the WHO eventually published. Her model also did well in calculating a key variable called the “basic reproduction number,” which is the number of secondary infections caused by each primary infection in the early phase of an epidemic. Rivers’s model came up with the number 2.2, not far from the WHO’s final figure of 1.8.
What wasn’t close was Virginia Tech’s crucial forecast of how big the epidemic might get. On 16 October 2014, the team published a paper saying there could be 175,000 cumulative cases in Liberia by the end of the year. It was a startling figure, especially in light of the fact that at the time of publication, there had been just 4,665 cases in that country. The prediction assumed that the length of time infected people stayed in the community and the fraction of them who were eventually hospitalized wouldn’t change. But even when the modelers ran the numbers with a radically different scenario—with all infected people hospitalized, and the length of time they spent in the community cut by one quarter—they still predicted that West Africa’s Ebola epidemic would be raging on New Year’s Day. “These results … suggest that the epidemic has progressed beyond the point wherein it will be readily and swiftly addressed by conventional public health strategies,” they wrote.
Virginia Tech’s forecast wasn’t the only troubling one. A team from Yale projected that Monrovia, Liberia’s biggest city, might see a total of 171,000 cases by Christmas if the epidemic-fighting efforts in place in September didn’t improve. Researchers at the CDC built a model that assumed more than half of cases were unreported and said Liberia and Sierra Leone might see an astounding 1.4 million Ebola cases by the end of January.
When 2015 dawned, however, the tally was nowhere near those predictions. The total was 20,712 cases in Guinea, Liberia, and Sierra Leone combined. And in all three countries, the epidemic had begun to ebb.
In a sense, the high forecasts were really worst-case scenarios. They assumed that additional treatment centers wouldn’t open up, contact tracing wouldn’t improve, and burial practices wouldn’t get safer. But all of those improvements were in fact taking place. The forecasting teams were also brave (or foolhardy) enough to make forecasts early, which required projecting months into the future. Other forecasters waited, built more sophisticated models, and used them to project just a few weeks ahead. A team led by a researcher at Northeastern University, in Boston, incorporated steadily improving infection control into its model. It predicted Liberia’s year-end total [PDF] would be 11,806 cases, which was close to the WHO’s final tally of 8,157. But that forecast was released on 7 January—after the end-of-year forecasting time frame.
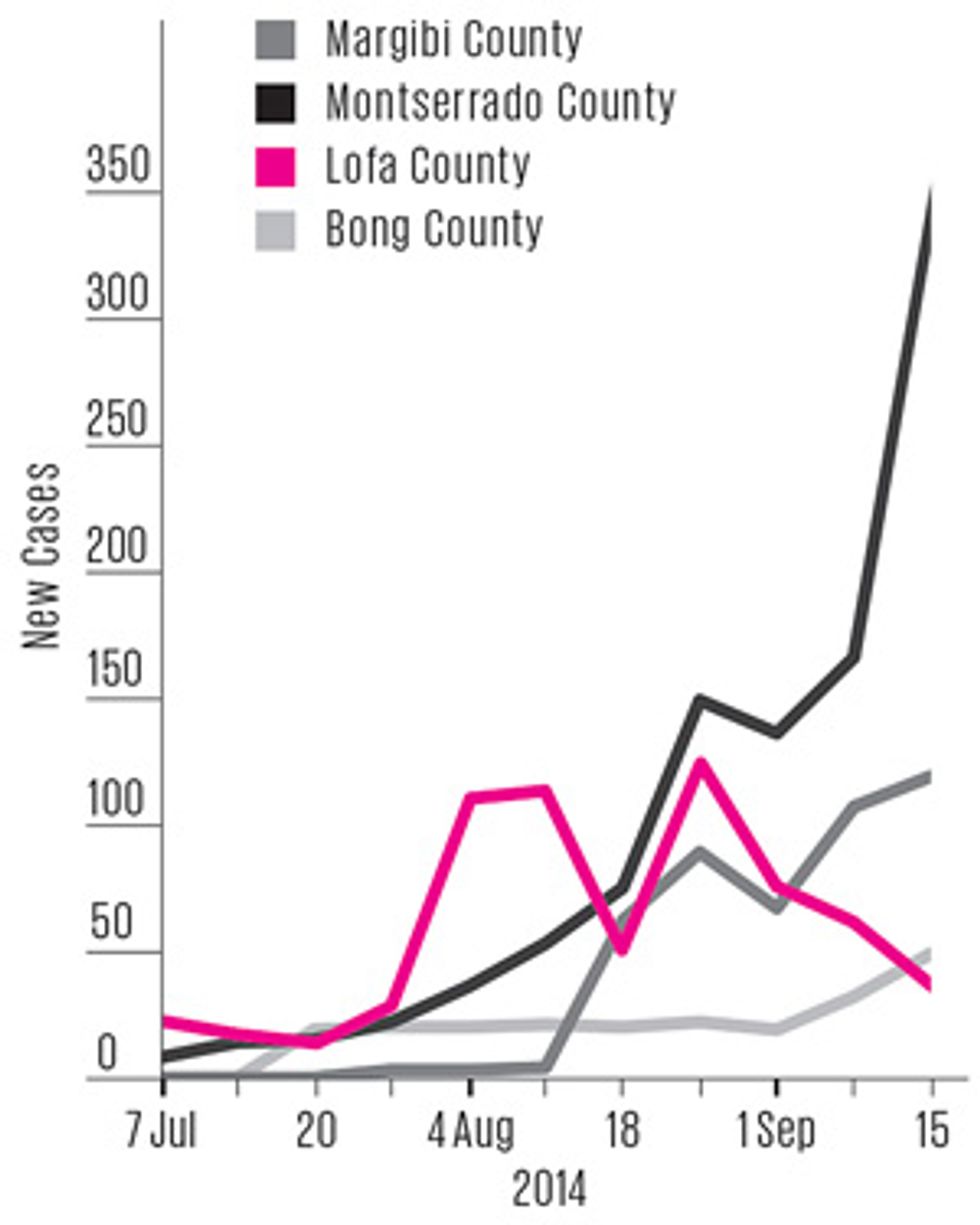 A Subtle Signal: Many Liberian counties reported alarming numbers of new cases in late August and September 2014—but in Lofa county (shown in pink), the numbers were dropping. Almost nobody noticed.Data Source: Virginia Bioinformatics Institute, Virginia Tech
In any case, the lack of accuracy should not be interpreted as an indication of the pointlessness of forecasting, modelers argued. Even inaccurate forecasts helped to quantify how interventions—singly or in combination, immediate or delayed—could change an epidemic’s trajectory. In so doing, they helped decision makers establish priorities.
And then there was the rhetorical utility of modeling. “Your assertion that models of the Ebola epidemic have failed to project its course misrepresents their aims,” Rivers wrote in the November 2014 letter to Nature. “They helped to inspire and inform the strong international response that may at last be slowing the epidemic.” Martin Meltzer, CDC’s head modeler, says: “I like to think we in a small way contributed to that ‘Go big, go quick’ response.” He makes no apology for the high-side estimate of 1.4 million cases.
The epidemic peaked in Liberia in the first week of September 2014—ironically, just about the time many overshooting modelers were preparing their forecasts. In hindsight, that peak might have been predicted if modelers had recognized the importance of what was happening in one particular part of the country.
Ebola entered Liberia through Lofa County, which borders on both Guinea and Sierra Leone, so its outbreak was the most “mature” one in the country. Lofa’s epidemic curve flattened out in August, and by early September case counts had fallen slightly for several weeks in a row. Analysts weren’t sure whether this decline was a blip or a real indicator of change. If the latter, it was evidence that public health campaigns in Lofa had finally convinced people to alter their behavior: to go to the hospital if they developed symptoms, to isolate exposed family members, and to consign the dead to “safe burial” teams. As the epidemic matured elsewhere and public awareness reached a critical threshold, all of Liberia might soon follow Lofa’s trend.
“Staring at the data, I saw inflection coming in the curve,” recalls Ira Longini, a modeler at the University of Florida who participated in the government-sponsored conference calls of epidemic modelers. “We had these weekly Ebola calls, and I pointed that out. Nobody seemed to pay any attention to it.”
As it happens, Virginia Tech’s Bryan Lewis had also noticed the data from Lofa. On 23 September, he put three slides labeled “Learning from Lofa” in his weekly presentation to the Defense Department, showing what Liberia’s epidemic curve would look like if it followed Lofa’s trend. The forecast was far less frightening than prior ones he’d presented to defense officials, but it wasn’t well received. “I got harshly criticized,” he recalls. “They thought it was a stupid experiment: ‘How do you know that Liberia is going to start acting like Lofa?’ ”
In hindsight it’s easy to recognize Lofa as a bellwether. It’s also easy to say now that researchers erred in calibrating their Ebola models while the outbreak was growing exponentially and in assuming the exponential growth would continue. Such projections were unlikely to produce accurate forecasts, because the virus’s transmission depends so heavily on changeable human behaviors.
The experts swear their models will work better next time. The Virginia Tech group is now creating an epidemic model that will represent the entire world and its complicated human occupants. Every country will have a “synthetic” population that stands in for the real one. There will be the right number of elementary school students per square mile, the right number of women in workplaces with more than 50 employees, the right number of households with fewer than five people, and myriad other demographic data slices. The model will also attempt to capture, at least roughly, what people do each day—the probability of leaving the home, going to a farm, getting on a bus or an airplane. Researchers don’t have those details for many places and will often have to infer them. For example, in estimating how many people labor in Liberia’s various types of workplaces, the Virginia Tech modelers are using data from Mexico. In other cases, an available database can give analysts a good approximation of unavailable information. Tracking the locations from which cellphone calls are made, for instance, gives a good moment-by-moment view of how people are moving in a region.
These “agent-based” models will give a more nuanced picture of how pathogens affect and sicken a population. “This is the wave of the future,” says Stephen Eubank, deputy director of the Virginia Tech lab. “It’s going to take a concerted effort to gather the data and the expertise. But it’s going to happen.”
And so, too, will another Ebola outbreak.
This article originally appeared in print as “Computer Modelers vs. Ebola.”
About the Author
In his reporting for this article, freelance journalist David Brown spent several days at the Virginia Bioinformatics Institute with the diverse team of computer scientists, biologists, and mathematicians who tried to predict the course of the West African Ebola outbreak. Brown himself combines several fields of expertise: He’s a physician who signed on with The Washington Post in 1991 for what he thought would be a short stint as a medical reporter. “That stretched on for 22 years,” he says.


