
On Assignment: For this article, reporter Emily Waltz tried out a variety of health-monitoring gadgets.
One warm night last February, I lay down to bed feeling like a lab mouse. A heat- and motion-sensing armband gauged my energy expenditure, another activity tracker clipped to my waistband recorded movement, a blood-pressure cuff connected to my iPad squeezed my right arm, and a brainwave-sensing headband would soon monitor my sleep. A scale linked by Bluetooth to an app on my iPad sat on the bathroom floor. With consistent use, these devices would provide a numeric picture of my general health and behaviors. They would give me intimate knowledge of my physical self, with all the information displayed neatly in graphs and charts.
Not too many years ago, you had to go to medical specialists to get this kind of biological data. Now, whether your problem is migraines or mood swings, you can keep track of your ailment with a consumer device that costs around US $100. As these health-and-wellness gadgets proliferate, a “ quantified self" movement is gaining strength: It's attracting athletes, fitness buffs, data lovers, hypochondriacs, and people just trying to lose some weight.
Many of these early adopters wear their health trackers around the clock and consider them the next must-have tech accessories. After all, our smartphones are already our constant companions, and we think nothing of stopping a conversation to Google-check our facts. It seems natural that we'll soon add mobile health devices to our attire and let the biometric stat-checking ensue.
Or will we? As a journalist, I wondered whether these devices would catch on. One way to judge that was obvious: Try out the technology myself. My mission, then, was to test the most popular health-monitoring gadgets on the market and see what they really offered.
My first impression was that self-quantifying is just another example of technology stretching the limits of narcissism—the kind of thing a compulsive oversharer on Facebook would like. But I had been looking for a solution to sleep problems that cropped up when my son was born a year ago and, without a better idea, figured that analyzing myself using hard numbers and graphs couldn't hurt. So as I plunged into this assignment, I was hoping to answer the question: Can these devices really enable us to change our behavior? Will they help us eat, sleep, and move better? Or are they just new toys?
When I became a lab mouse in February, here's what I looked like in numbers. Sleep: 6 hours, 35 minutes; energy burned per day: 2306 kilocalories (9648 kilojoules); kilocalories consumed per day: 2269; moderate activity per day: 2 hours, 38 minutes; vigorous activity per week: 56 minutes; blood pressure: 102/65; resting heart rate: 66 beats per minute; weight: 55 kilograms (122 pounds); body mass index (BMI): 18.5.
Six and a half hours of fragmented sleep is abysmal for me. I used to go to bed at 11:00 p.m. and wake up refreshed 8 or 9 hours later. That changed when my son was born and for months needed feeding two or three times a night. My husband and I slogged through that ordeal as all new parents do, catching daytime naps and trading off nighttime duties. My husband went right back to sleep after attending to our son, but I couldn't. The anxiety of knowing I had to get up again in a few hours kept me awake longer and longer as time went on. Eventually, I stopped being able to get back to sleep at all. Even after my son started sleeping through the night, I continued to lie awake for hours and never felt rested during the day.
February's stats suggested that sleep deprivation was affecting my health. I weighed less than I did before I was pregnant, and if I lost another pound it would put my BMI in the “underweight" category. I wasn't getting nearly as much cardio exercise as I used to, partly because I was too tired to push myself at the gym. One day a few months earlier I had nearly collapsed from exhaustion during a tennis match. I already knew I wasn't well, and quantifying how badly I was doing fully confirmed my instincts.
The Zeo Sleep Manager is as sleek as a Velcro-and-plastic headband can be, but there's nothing about it that says “bedtime." Nevertheless, nearly every night for two months I slipped it on, positioning the plastic enclosure so its sensors would rest against my forehead.
The Zeo can determine when you're in rapid-eye-movement (REM) sleep, light sleep, deep sleep, or awake. The headband wirelessly sends readings throughout the night to your nearby iPad or iPhone, and in the morning the Zeo app gives you a color-coded graph showing how you slept. There's also a bedside model that transmits the signal from the headband to a base station where you can view the data.
The headband's three sensors work by detecting electrical activity in the skin of the forehead. Microvolt-level changes arise from three different biological mechanisms, starting with brain-cell activity, which the Zeo detects by electroencephalography. The sensors also pick up the electric pulses that cause contractions of the frontalis muscle, which stretches across the forehead and moves the eyebrows. Finally, the sensors detect eye movements: Because each eye functions like a dipole with a positive and a negative side, the eye's movements cause changes in an electric field that can be tracked in the skin. All this electrical activity is combined into one digital signal that shows both the frequency and duration of the various voltage changes.
The information is then fed into a processor within the headband that determines your stage of sleep based on the signal's electrical features. To develop their signal-processing algorithms, company researchers strapped Zeo units as well as lab-grade sleep monitors onto volunteers and recorded their slumber. A professional sleep scorer determined each volunteer's sleep stages based on the data from the lab-grade monitor. Researchers then “trained" their algorithms to match the signals coming from the Zeo's sensors to the sleep stages determined by the professional scorer.
So what's it like to use the thing? Despite some maddening glitches—I had to contact customer service three times to resolve bad connections between the headband and my iPad—the Zeo seems accurate. I tested it by jotting down the times I was awake overnight and checking them in the morning. A 2011 study published in the Journal of Sleep Research compared the Zeo with lab-grade sleep measurement tools and concluded that the Zeo does pretty well. “It's not the gold standard, but it's reliable enough," says James Maas, a retired professor of psychology at Cornell University and coauthor of Sleep for Success (AuthorHouse, 2011).
My time with the Zeo gave me plenty of information—but no relief. Zeo awards a “ZQ" sleep-quality score from 0 to 120, with 120 being the best sleep. On average, my ZQ was 66 (pretty shabby), and it got slightly worse over two months. The sleep graphs were both unnerving and addictive. REM sleep, when vivid dreaming takes place, is supposed to occur every 90 minutes and is thought to be critical for the consolidation of memories. A well-rested person will drop into REM sleep four or five times a night, with each REM period longer than the last. My REM-sleep graph told a different tale. I was getting only three or four REM periods, with later intervals so disrupted by awakenings that they were just as short as the early ones. On my graph, tall red spikes representing awakenings sliced up what should have been solid blocks of green-line REM sleep. Seeing just how poorly I was sleeping in black and white—or rather in red and green—convinced me I had to find the culprit.
![]()
To look for answers, I turned to the rest of my gadgets.
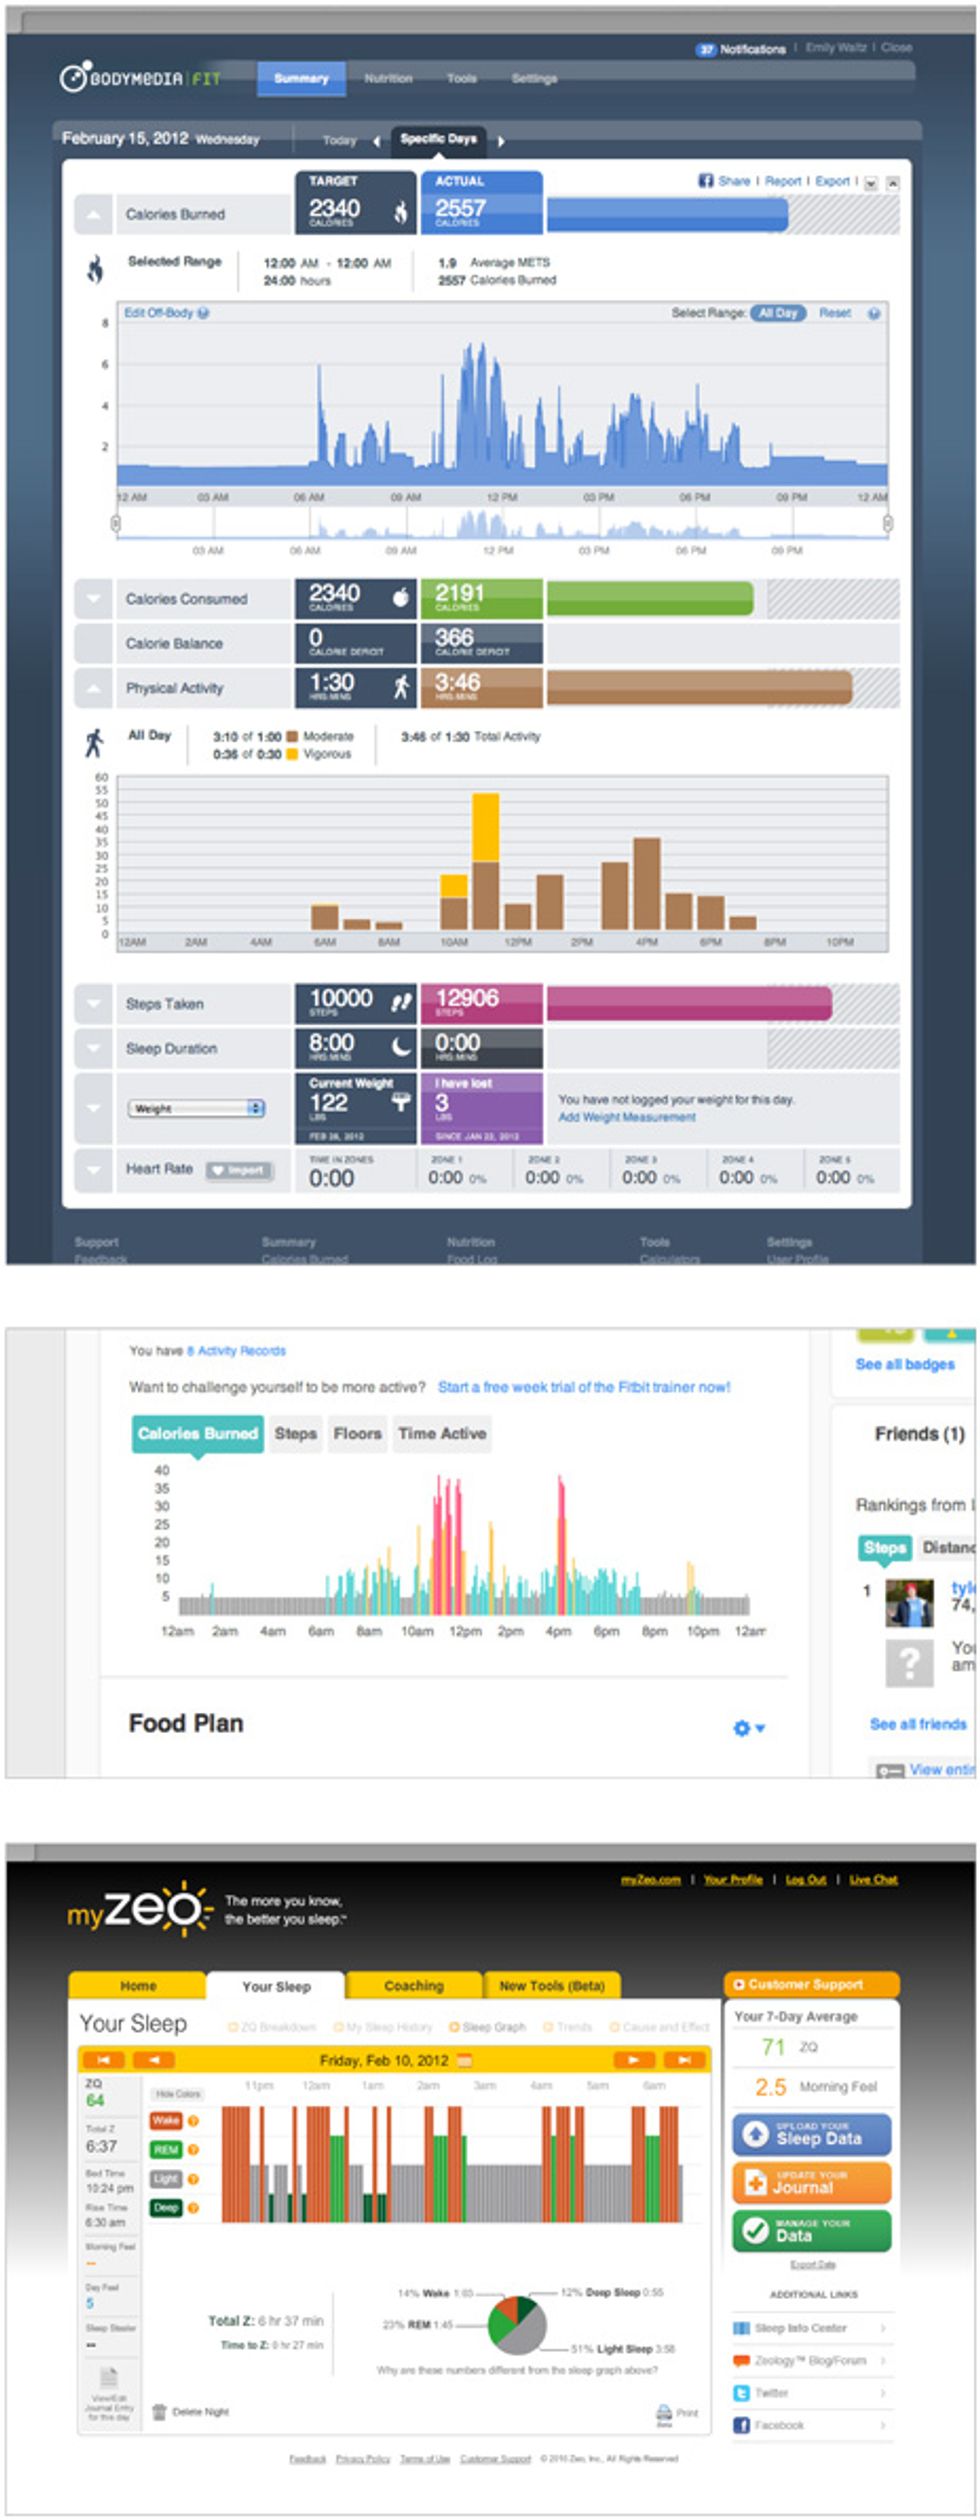
Gregory Welk, director of the Nutrition and Wellness Research Center at Iowa State University, has tested the accuracy of this new generation of wellness devices. In 2011, Welk strapped eight activity trackers and one lab-grade monitor onto each of 51 volunteers. For 71 minutes the volunteers ran on treadmills, swept floors, biked, and walked outside with heavy backpacks while the gizmos measured their energy expenditure. The most accurate commercial unit, Welk found, was the BodyMedia Fit, an armband whose data deviated from the lab-grade monitor's results by less than 1 percent. A distant second, at 11 percent off, was the Fitbit, a thumb-size device that clips onto your waistband.
BodyMedia's armband is distinguished by the sophistication of its sensors and algorithms. Most activity monitors are simple pedometers or accelerometers that sense motion. BodyMedia has additional physiologic sensors that pull information from your skin, including its temperature and electrical conductance, which varies with how much you sweat. The data from these skin sensors, along with measurements of ambient temperature, allow the device to determine the rate of heat-energy transfer, which in turn lets the unit calculate the extra effort you expend when you're running up a gradual incline or carrying something heavy.
The armband's software crunches about 5000 data points per minute. It first employs statistics-based algorithms to classify the activity the user is likely doing, such as walking, running, or biking. The software takes into account the user's weight, age, and gender. Finally it applies an intensity factor—how hard the user is working—based on data from the motion, heat, and sweat sensors, and it assigns each activity an energy-expenditure value. As with Zeo, BodyMedia's algorithms were tuned by collecting data from volunteers.
Fitbit, by contrast, contains only an accelerometer, a pedometer, and an altimeter. It can tell how many stairs you've climbed, but it has no idea if you're also toting a 1-year-old and a bag of groceries. I wore both BodyMedia and Fitbit during my tenure as a lab animal and did some side-by-side comparisons. During one particular week in February, BodyMedia estimated I burned 2248 kilocalories a day on average, whereas Fitbit came up with 2012. Knowing that BodyMedia is more accurate, I found myself using that data.
When I connected my BodyMedia armband to my computer through a USB cable, my stats popped up through the company's website. There's lots of information: a pie chart and four timelines that show energy burned per minute, vigorous activity versus moderate activity, steps per hour, and a crude estimation of sleep. BodyMedia's website tallies up your averages over days or weeks, and it keeps your history so you can look back through previous days. In a moment of geeky nostalgia, I clicked through my graphs for February and March and was able to spot the night I went to the symphony (a couple of hours with almost no movement). I also found the day I backed my car into my husband's—an event marked by my jumping out of the car and vigorously waving my arms (short spikes on the graph).
BodyMedia's meal-logging function allows you to input what you ate that day, and the program calculates your kilocalories consumed. But typing in the food information is painfully tedious and probably futile. “These devices do a good job measuring output, but not input," says James Hill, director of the Center for Human Nutrition at the University of Colorado. “Our research has shown that people are not within 60 percent of what they actually eat. It's not that people are lying. It's that it's very, very hard." BodyMedia has a database with thousands of foods, yet what I was looking for never seemed to be listed. So I would manually copy numbers from nutrition labels or input the weight of every raw ingredient in a meal in an attempt to get an accurate count.
After two months I had tons of data, but it was spread across three websites and three iPad apps. I needed a way to collect and analyze it all in one place. Health-management companies U.S. Preventive Medicine and Qualcomm Life have developed an app called Macaw that will do just that, but it wasn't yet set up for my devices. So I did something low tech: I made a spreadsheet. I knew that exercise, alcohol, caffeine, big late dinners, and blood pressure are all linked to sleep quality, so I compared those numbers with each night of sleep data. Right away I ruled out blood pressure. The iHealth blood pressure monitor, which connects to an iPad or iPhone and stores your history through an app, said mine stayed low, around 102/65. That has been my blood pressure since long before my sleep problems developed.
In my spreadsheet, some correlations emerged. On days I did vigorous exercise like tennis or jogging, precious deep sleep increased 12 percent on average. Nights that I drank an alcoholic beverage or two, my time awake increased 48 percent and my REM sleep decreased 7 percent. And on nights when I ate more than my average number of kilocalories at dinner I was awake 51 percent more than usual—although that last figure is skewed by one particularly sleepless night.
It's known that feedback—seeing our own biological data in front of us—can affect our behavior. Several years ago David Levitsky, a nutritionist at Cornell, set up an experiment to see whether college freshmen could avoid the weight gain typical among first-year students. Levitsky separated students into two groups: one that weighed themselves every morning for 12 weeks and a control group that didn't. At the end of the 12 weeks, the students in the control group gained an average of 3 kg (7 pounds), but the students who weighed themselves every day collectively gained no weight. Feedback helped them dodge the dreaded freshman bulge.
Whether objective data can motivate people to make more dramatic lifestyle changes is unclear, say public health specialists. Joseph Kvedar, head of the Center for Connected Health at Harvard, is a proponent of health trackers. But he has found that only a small portion of the population, around 10 percent, will change their behavior based on tracker information alone. That 10 percent is composed of people inherently interested in data, like fitness buffs and “quantified selfers," the newly recognized class of nerdy people who revel in using technology to track their daily lives. Everyone else needs an additional motivator, he says, like coaching, social networking, games, or rewards.
Some device makers have picked up on that. Zeo offers a seven-step coaching program, and Fitbit offers an online community where you can compete with and trash talk your friends. Fitbitters have sorted themselves into groups like Walking at Work Treadmill Desk Users and my favorite: Crime Fighter Fitbit Users.
But even with these added motivators, the value of these devices to the general public remains unresolved. Hill at the University of Colorado, who is also cofounder of the National Weight Control Registry, says he has not seen any research suggesting that activity monitors like BodyMedia and Fitbit can help the average person lose weight. “We have to give people a reason to change and to exercise more and eat less, and I don't think information or data is enough," Hill says.
By the end of my experiment, I'd realized that mere data probably isn't enough to motivate me either. The stats made it clear that less alcohol and more exercise would improve my sleep. But lazing about the house with my husband, my son, and a glass of wine is my favorite thing to do, and I suspect that no amount of data will make me change my ways. Obsessing over my health data, however, was a much easier habit to kick. After two months of quantifying and analyzing, it felt blissful to unstrap all my monitors, forget about my daily stats, and just fall asleep.