
When it comes to reconstructing the past, you might think that astrophysicists have it easy. After all, the sky is awash with evidence. For most of the universe’s history, space has been largely transparent, so much so that light emitted by distant galaxies can travel for billions of years before finally reaching Earth. It might seem that all researchers have to do to find out what the universe looked like, say, 10 billion years ago is to build a telescope sensitive enough to pick up that ancient light.
Actually, it’s more complicated than that. Most of the ordinary matter in the universe—the stuff that makes up all the atoms, stars, and galaxies astronomers can see—is invisible, either sprinkled throughout intergalactic space in tenuous forms that emit and absorb little light or else swaddled inside galaxies in murky clouds of dust and gas. When astronomers look out into the night sky with their most powerful telescopes, they can see no more than about 10 percent of the ordinary matter that’s out there.
To make matters worse, cosmologists have discovered that if you add up all the mass and energy in the universe, only a small fraction is composed of ordinary matter. A good 95 percent of the cosmos is made up of two very different kinds of invisible and as-yet-unidentified stuff that is “dark,” meaning that it emits and absorbs no light at all. One of these mysterious components, called dark matter, seems immune to all fundamental forces except gravity and perhaps the weak interaction, which is responsible for some forms of radioactivity. We know dark matter must exist because it helps bind rapidly moving stars to their host galaxies and rapidly moving galaxies to even larger galaxy clusters. The other component is “dark energy,” which seems to be pushing the universe apart at an ever-increasing rate.
To identify these strange dark substances, cosmologists require more than just the evidence collected by telescopes. We need theoretical models of how the universe evolved and a way to test those models. Fortunately, thanks to progress in supercomputing, it’s now possible to simulate the entire evolution of the universe numerically. The results of these computational experiments have already been transformative, and they’re still only in their early days.
My colleagues and I recently completed one such simulation, which we dubbed Bolshoi, the Russian word for “great” or “grand.” We started Bolshoi in a state that matched what the universe was like some 13.7 billion years ago, not long after the big bang, and simulated the evolution of dark matter and dark energy all the way up to the present day. We did that using 14 000 central processing units (CPUs) on the Pleiades machine at NASA’s Ames Research Center, in Moffett Field, Calif., the space agency’s largest and fastest supercomputer.
Bolshoi isn’t the first large-scale simulation of the universe, but it’s the first to rival the extraordinary precision of modern astrophysical observations. And the simulated universe it produces matches up surprisingly well with the real universe. We expect Bolshoi’s computer-generated history of the cosmos to improve the understanding of how the Milky Way (the galaxy we live in) and other galaxies formed. If we’re lucky, it might just reveal crucial clues to the nature of the mysterious dark entities that have steered the evolution of the universe and continue to guide its fate.
Cosmology took a dramatic turn in 1998. That’s when two teams, both studying light from past stellar explosions, showed that the universe isn’t expanding as expected. Astronomers have been aware of the overall expansion of the universe for many decades, but most figured that this expansion must either be slowing or coasting along at a steady rate. So they were astonished to discover that the cosmos has, in fact, been expanding faster and faster for the past 5 billion years, pushed apart by a mysterious pressure that pervades space.
Although nobody knows what the dark energy that creates this pressure is, its discovery has actually been a boon for cosmology. It helped clear up a lot of old contradictions, including indications that some of the stars in our galaxy were older than the universe itself.
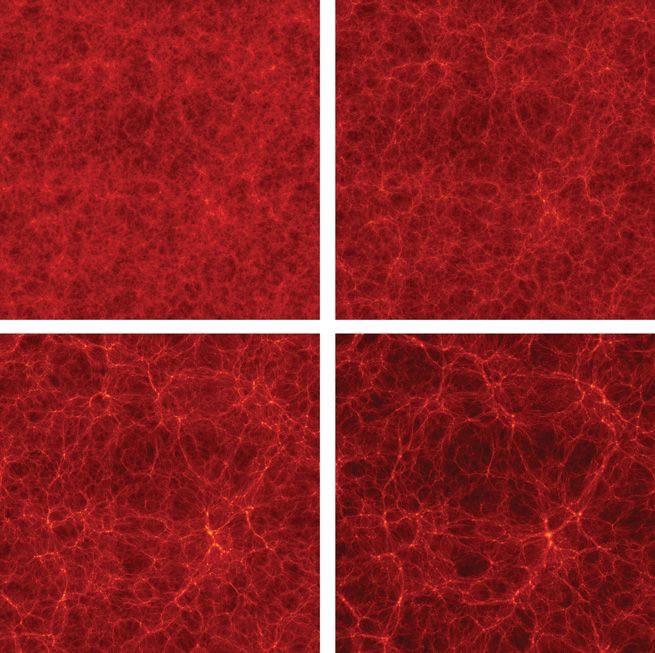
Nowadays, cosmologists have settled on a basic picture of a universe—one that’s still full of mysteries but is at least quite self-consistent. The universe is about 13.7 billion years old and dominated by dark stuff: roughly 22 percent dark matter and 73 percent dark energy. Although dark energy strongly shapes the universe today, dark matter was more influential early on. It clumped up, producing a weblike scaffold that drew in ordinary matter and enabled the formation of all the galaxies as well as larger structures, including the galaxy groups and clusters we see today.
Telescopes on the ground and in space, like NASA’s Wilkinson Microwave Anisotropy Probe (WMAP), launched in 2001, provided key evidence for developing this basic understanding of the universe. But cosmologists couldn’t have arrived there without computer simulations to verify their interpretation of what they were seeing.
The most influential such simulation so far has been the Millennium Run, which was developed by a team led by Volker Springel, who is now at the University of Heidelberg. Completed in 2005, the Millennium simulation was the first to be big enough and detailed enough to model the evolution of an entire population of galaxies from their birth, 70 million or so years after the big bang, up to the present day. (Galaxies are the tracer particles in cosmological simulations. By comparing the simulated population with astronomical observations, cosmologists can see how well their models of the universe match reality.)
The Millennium simulation was a big step forward, and it’s been the basis for more than 400 research papers. But that simulation had a few nagging shortcomings. For one thing, Millennium—as well as a later, smaller, but higher-resolution simulation called Millennium II—used very early WMAP results. Released in 2003, those data were from the first year of the telescope’s operation, and they weren’t very precise. As a result, the Millennium simulation made some predictions about galaxy populations that don’t match very well with observations. What’s more, although Millennium II had enough resolution to model the dark matter component of smaller galaxies (like the Milky Way’s nearby companion, the Large Magellanic Cloud), it didn’t simulate a large enough volume of space to enable precise predictions about the statistics of such satellite galaxies.
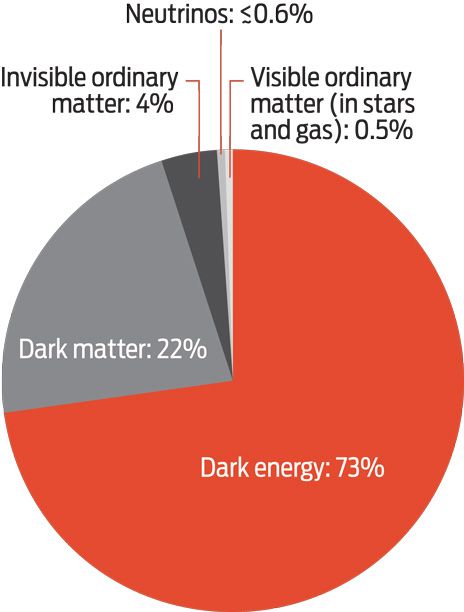
Mostly Dark: If you add up all the matter and energy in the universe, you’d find little that is familiar. The stars and gas that astronomers see in their telescopes make up just 0.5 percent of the cosmos. Just 0.01 percent of the universe is made of elements heavier than hydrogen or helium. Because of uncertainties, the numbers in this chart do not add up to 100 percent.
Click on the image to enlarge.
To help remedy this situation, my team at the University of California, Santa Cruz, partnered with Anatoly Klypin’s group at New Mexico State University, in Las Cruces. Our aim was to improve on Millennium’s size and resolution and to incorporate the very best knowledge of key cosmological parameters, derived in part from the latest WMAP results.
To simulate the universe inside a computer, you have to know where to start. Fortunately, cosmologists have a pretty good idea of what the universe’s first moments were like. There’s good reason to believe that for an outrageously brief period—lasting far less than 10-30 second, a thousandth of a trillionth of a femtosecond—the universe ballooned exponentially, taking what were then minute quantum variations in the density of matter and energy and inflating them tremendously in size. According to this theory of “cosmic inflation,” tiny fluctuations in the distribution of dark matter eventually spawned all the galaxies.
It turns out that reconstructing the early growth phase of these fluctuations—up to about 30 million years after the big bang—demands nothing more than a laptop computer. That’s because the early universe was extremely uniform, the differences in density from place to place amounting to no more than a few thousandths of a percent.
Over time, gravity magnified these subtle density differences. Dark matter particles were attracted to one another, and regions with slightly higher density expanded more slowly than average, while regions of lower density expanded more rapidly. Astrophysicists can model the growth of density fluctuations at these early times easily enough using simple linear equations to approximate the relevant gravitational effects.
The Bolshoi simulation kicks in before the gravitational interactions in this increasingly lumpy universe start to show nonlinear effects. My colleagues and I began by dividing up a cubical volume of the simulated universe into a uniform, three-dimensional grid, with 2048 lines running in each direction. We placed a simulated dark matter particle at each of the resulting 8.6 billion grid-line intersections.
In the real universe, there are likely to be far more dark matter particles than in a single cubic kilometer of space. But using a realistic number would overwhelm even the largest supercomputer. So we used this relatively small set, setting the mass of each simulated particle quite high so that it represents a huge amount of matter. We found that we could get pretty good results using these ultramassive placeholders, each set to about 100 million times the mass of the sun, about a hundredth of a percent of the total mass of dark matter in the Milky Way. After laying out one of these particles at each grid point, we shifted each starting location slightly to match our theoretical estimate of the primordial density fluctuations in the early universe.
Because our simulation was supposed to model boundary-less space and not a walled patch of universe, we followed the convention that’s used in many video games, including that old classic Asteroids, where if a player’s ship goes off the right edge, for example, it reemerges from the left side. In this way, we made our simulation represent a random, borderless chunk of the universe.
The last thing we did before setting the simulation in motion was to prime all the particles by assigning them initial velocities depending on the degree to which each particle was shifted away from a grid intersection. Then we flipped the switch and, like a divine watchmaker, sat back and watched what happened next.
Once the simulation began, every particle started to attract every other particle. With nearly 10 billion (1010) of them, that would have resulted in roughly 1020 interactions that needed to be evaluated at each time step. Performing that many calculations would have slowed our simulation to a crawl, so we took some computational shortcuts. One was an algorithm called adaptive mesh refinement, which adjusts the resolution of the simulation depending on how closely particles are grouped together. If there are too many particles in a single cell, this approach divides that cell into eight smaller cells and calculates the interactions between particles with finer time and spatial resolution. This algorithm allows the simulation to dedicate most of its computational power where it’s needed: in those small regions of the simulation where particles tend to cluster.
As Bolshoi ran, we logged the position and velocity of each of the 8.6 billion particles representing dark matter, producing 180 snapshots of the state of our simulated universe more or less evenly spaced in time. This small sampling still amounts to a lot of data—roughly 80 terabytes. All told, the Bolshoi simulation required 400 000 time steps and about 6 million CPU-hours to finish—the equivalent of about 18 days using 14 000 cores and 12 terabytes of RAM on the Pleiades supercomputer. But just as in observational astronomy, most of the hard work comes not in collecting mountains of data but in sorting through it all later.
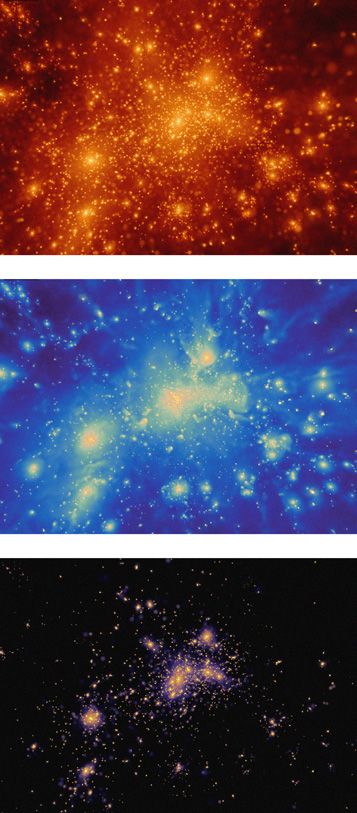
To make sense of Bolshoi’s output, the first thing my colleagues and I did was to analyze each snapshot in search of what in the real universe corresponds to galaxies. We did this by identifying distinct groupings of dark matter particles bound together by gravity. Astronomers call these bound clumps “halos” because they seem to be rather fuzzy clouds that extend in all directions beyond the visible boundaries of galaxies. In Bolshoi, these halos numbered up to 10 million at each time step. We characterized them in many different ways, measuring such properties as size, shape, orientation, mass, velocity, and rotation.
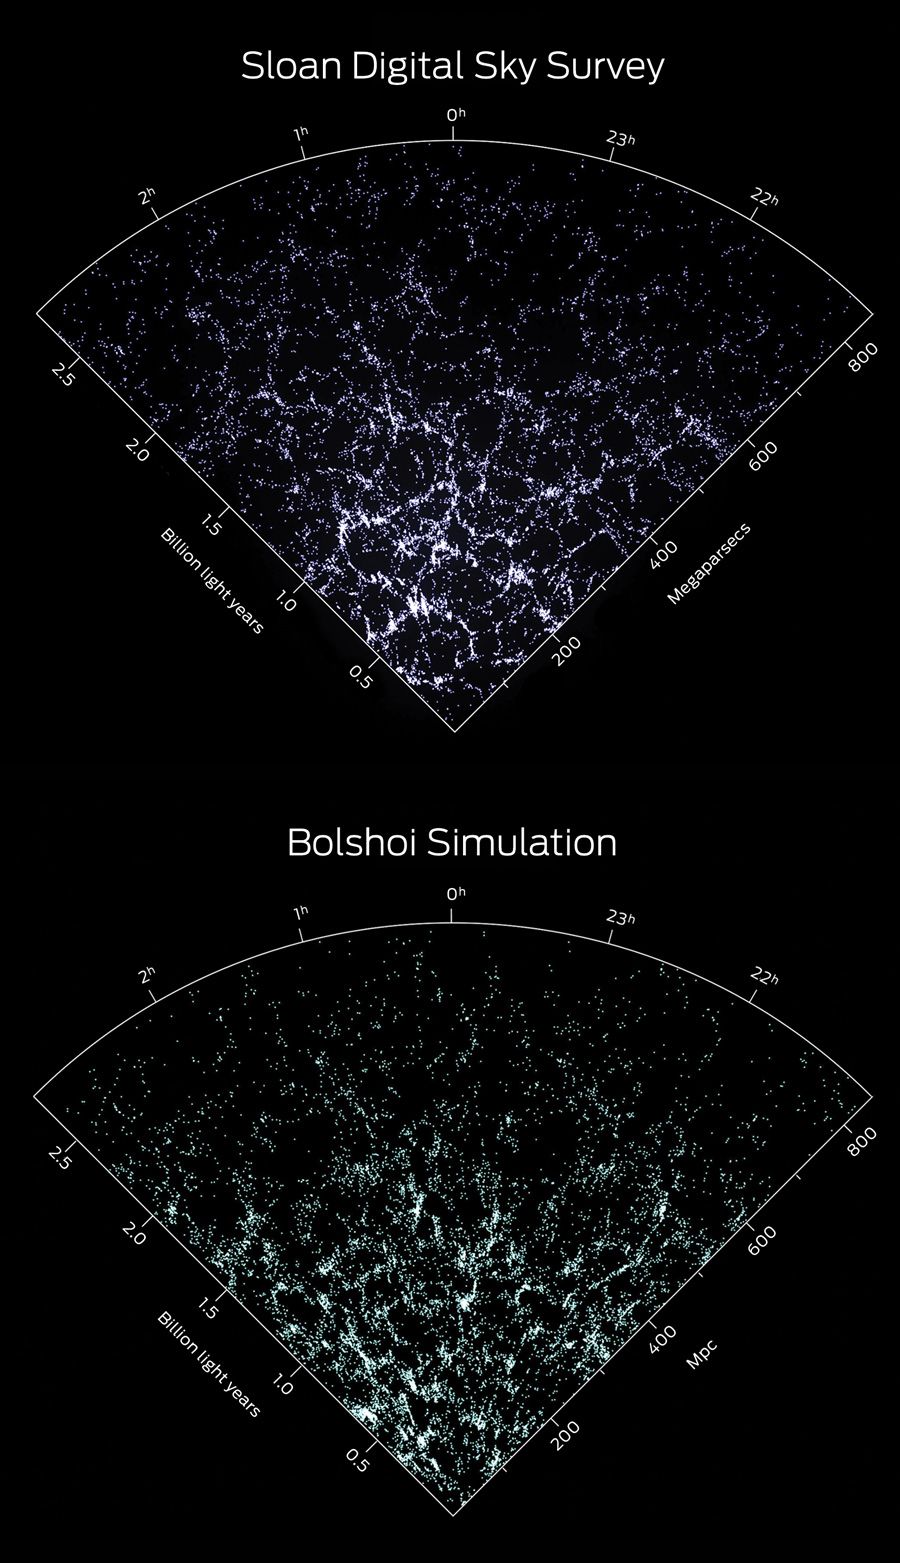
The Bolshoi simulation would be just an expensive fantasy if it didn’t match observations of the real universe. The simplest way to make a comparison is to assign basic galactic properties to each of the Bolshoi dark matter halos. We know from observations that the more luminous a galaxy is, the faster its stars move. So we rank the halos by how rapidly the dark matter particles move in them, and we rank observed galaxies by their luminosity, and then we match the two distributions.
This process gives each simulated halo a likely galactic identity. We don’t expect each galaxy to be a literal match, but we would hope that the overall statistics of the simulated galaxy population corresponds to what we see in the night sky.
One way to find out is to examine the probability of finding a galaxy within a given distance of another galaxy. To our delight, we found the Bolshoi simulation agrees quite well with astronomical observations in this regard. It did much better than the Millennium simulation, which ended up, for example, with about twice as many pairs of Milky Way–size galaxies separated by up to 3 million light-years as have actually been observed.
We performed other checks as well. For example, using the halo data from the Bolshoi simulation, Risa Wechsler’s group at Stanford calculated that about 5 percent of the time, a Milky Way–size galaxy should host two satellite galaxies as bright as our galaxy’s Large and Small Magellanic Clouds. We also calculated how often there would be just one such bright satellite galaxy and how often there would be none at all. When we compared those statistics with data collected by the ground-based Sloan Digital Sky Survey, we found remarkable agreement.
Yet another way to compare simulations with observations is to consider the number of galaxies with their stars and gas moving at various velocities. Here we found a good match with astronomical observations. But we also found a problem: The Bolshoi simulation ended up with many more galaxies containing relatively slow-moving stars than have actually been observed. It remains to be seen whether this is a serious issue. Perhaps it hints at an undiscovered property of dark matter. Or it could just represent astronomers’ inability to detect the faintest galaxies. Deeper surveys are now under way that could help answer this question.
One of the most important products of our early analysis of the Bolshoi output—one that we expect will become an important resource for the astrophysical community—is the “halo merger tree.” This tree describes the history of each halo, showing how each one formed from mergers with other halos all the way back to the beginning of the simulation.
We can use this merger tree to feed an improved model for the formation of galaxies, one that describes in a few equations basic properties like mass, luminosity, shape, stellar age, and elemental abundances. So far, my research group and others with early access to the Bolshoi results have found very good agreement between our models and the observed properties of nearby galaxies. We are also finding that these models can help make sense of Hubble Space Telescope images that show what galaxies looked like just a few billion years after the big bang.
As you might imagine, no one simulation can do everything. Each must make a trade-off between resolution and the overall size of the region to be modeled. The Bolshoi simulation was of intermediate size. It considered a cubic volume of space about 1 billion light-years on edge, which is only about 0.00005 percent of the volume of the visible universe. But it still produced a good 10 million halos—an ample number to evaluate the general evolution of galaxies.
In addition, my colleagues and I have also run a larger, lower-resolution simulation, called BigBolshoi, which models a cube 4 billion light-years across, a volume 64 times as great as that shown by Bolshoi. The BigBolshoi simulation allowed us to probe the properties of galaxy clusters: clumps of galaxies that typically span about 10 million light-years and can have masses more than 1000 times as large as the total mass of the Milky Way. And we are running another simulation on NASA’s Pleiades supercomputer called miniBolshoi, to focus in more detail on the statistics of galaxies like the Milky Way.
As supercomputers become more powerful, astrophysicists would like to run a large-scale, high-resolution simulation of the universe that includes the complex interplay within galaxies of gas, stars, and supermassive black holes. These sorts of simulations could be used to create a sort of field guide that could help astronomers interpret their telescope images, by telling them what galaxies should look like at various stages of their lives. With today’s supercomputers and codes, though, it is possible to do such high-resolution simulations in only relatively small regions containing one or at most a few large galaxies.
One of the biggest hurdles going forward will be adapting to supercomputing’s changing landscape. The speed of individual microprocessor cores hasn’t increased significantly since 2004. Instead, today’s computers pack more cores on each chip and often supplement them with accelerators like graphics processing units. Writing efficient programs for such computer architectures is an ongoing challenge, as is handling the increasing amounts of data from astronomical simulations and observations.
Despite those difficulties, I have every reason to think that numerical experiments like Bolshoi will only continue to get better. With any luck, the toy universes I and other astrophysicists create will help us make better sense of what we see in our most powerful telescopes—and help answer some of the grandest questions we can ask about the universe we call our home.
This article originally appeared in print as "The Universe in a Supercomputer."
Visit the Bolshoi simulation website.
About the Author
Joel R. Primack is a physics professor at the University of California, Santa Cruz, and director of UC’s High-Performance AstroComputing Center. Back in the early 1980s, pencil and paper were the tools of choice for cosmologists. “Now high-performance computers have become vital,” Primack says. “They’ve helped transform cosmology from philosophical speculation into what’s almost an experimental science.”