Optical fibers can do more than transmit data—they can actually sense what’s going on around them, including the earliest rumbles of an earthquake.
For the past year, Biondo Biondi, a professor of geophysics at Stanford University, has used a 4.8-kilometer (or 3-mile) test loop of optical fibers installed on the Stanford campus to record vibrations caused by earthquakes, and distinguish those from vibrations caused by other sources, such as passing cars.
His team has recorded 800 seismic events using this fiber optic seismic observatory since September 2016, including signals from the recent Mexico earthquake and vibrations from blasting at quarries in the area. The fibers can distinguish between two types of earthquake waves, the P wave and the S wave. That’s important for earthquake warning systems, because P waves travel faster but S waves cause more damage.
Using optical fibers to monitor seismic events is not a new technology—it’s standard operating procedure for oil and gas companies. However, this involves first stabilizing the fibers by attaching them to a surface, like a pipeline, or encasing them in cement. Biondi’s project used loose fiber optic cables laying inside plastic pipes, mimicking a standard optical communications installation.
“People didn’t believe this would work,” said Eileen Martin, a graduate student on the project, in a prepared statement. “They always assumed that an uncoupled optical fiber would generate too much signal noise to be useful.”
Both stabilized and loose optical fiber seismic monitoring systems work by using innate impurities in optical fibers as virtual sensors. An “interrogator” installed at one end of the line sends pulses of laser light into the fiber and monitors the light that bounces back—the backscatter. Changes in the timing of backscattering occur when the fiber stretches and contracts—something that happens when the ground moves during an earthquake.
A single interrogator can cover some 40 kilometers of fiber, Biondi says, and monitor a virtual sensor every couple of meters. The resolution of these systems is steadily improving. His project has demonstrated, he says, that “a network of millions or billions of sensors already exists in the telecom lines,” he says, we just have to tap into it.
Biondi, whose main research interest has involved turning seismic data collected by oil and gas exploration companies into images of geological structures, started thinking about optical fibers about five years ago, when his home was wired as part of an early trial of the Google Fiber project. “It seemed so simple to install,” he told me. Then Martin, during a summer research stint at a national laboratory, told him about researchers she’d met who were planning to use fiber optic cables to monitor the thawing of the permafrost in Alaska.
The third piece of the puzzle fell into place when Biondi discovered that a former student in his research group was working for a company that makes hardware for monitoring backscatter in fiber optic cables, and, in the summer of 2015, he launched what he calls the “Billion Sensors Earthquake Observatory” project.

Using optical fiber-based virtual sensors, Biondi points out, “will be always worse quality than the standard sensors a seismologist has out there. But those sensors are very expensive, so earthquake networks can only afford to have one every 20 km or so, even in Bay Area. With fiber optics, I’m talking about having a sensor every few meters. So, an array of these sensors can be more sensitive than an individual seismic sensor; it might let us see small earthquakes that can’t be identified with normal sensors.”
Biondi’s team plans to install another test array over a broader area starting in 2018. This, he hopes, will allow his group to identify earthquakes that conventional networks in the area miss. “That would be a big step forward to getting the community and the government to pay attention.”
The greatest thing about this approach to earthquake monitoring, Biondi points out, is also its biggest challenge. “It can use existing communications lines,” he says, “but that means there is the whole issue of convincing telecoms that they should make them available.”
A comprehensive paper describing the project will be published in the December issue of the geophysics journal, The Leading Edge, and details on the signal processing methods used will appear in the January issue of the IEEE Signal Processing Magazine.
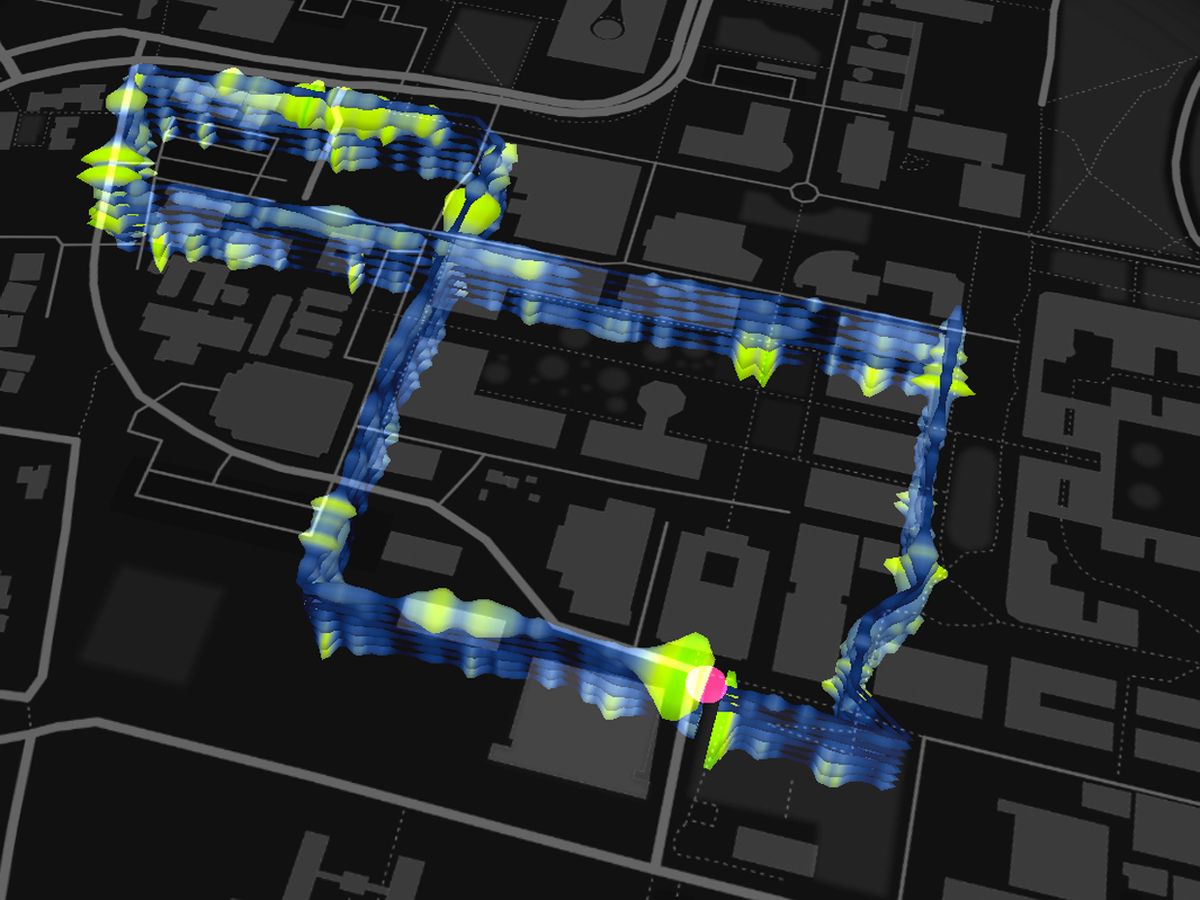
Separately, data from the Stanford test loop has also been used as part of a visualization project by Stamen Design and the Victoria and Albert Museum, called Big Glass Microphone [photo, top]. “I’m always looking for new sources of data,” said Eric Rodenbeck, CEO of Stamen Design. Stanford gave Rodenbeck a 10-minute sample of data. Based on changes in backscatter, Rodenbeck was able to distinguish between stationary but active objects like fountains and moving objects, large (cars), and small (bicycles).
“The idea of an incidental infrastructure, that digital infrastructure of the world itself is a gigantic sensing device,” is fascinating, he says. “Things in the world have signals. Wouldn’t it be great if we could do something with them?”
Tekla S. Perry is a senior editor at IEEE Spectrum. Based in Palo Alto, Calif., she's been covering the people, companies, and technology that make Silicon Valley a special place for more than 40 years. An IEEE member, she holds a bachelor's degree in journalism from Michigan State University.


