Governments and NGOs need economic data to decide how best to aid the poor. But reliable, up-to-date data on poverty levels is hard to come by in the world’s poorest countries.
Scientists have now devised an inexpensive technique that combines satellite images and machine learning to accurately predict poverty levels at village level. Such a fine-grained gauge of poverty could help aid programs target those with the greatest needs. It could also be a valuable tool for researchers and policymakers to gather national statistics and set development goals.
Governments typically conduct surveys of income and consumption to measure poverty levels. These surveys cost hundreds of millions of dollars and are impossible to conduct in areas of conflict. World Bank data show that between 2000 and 2010, 39 out of 59 African countries conducted fewer than two surveys that were extensive enough to measure poverty.
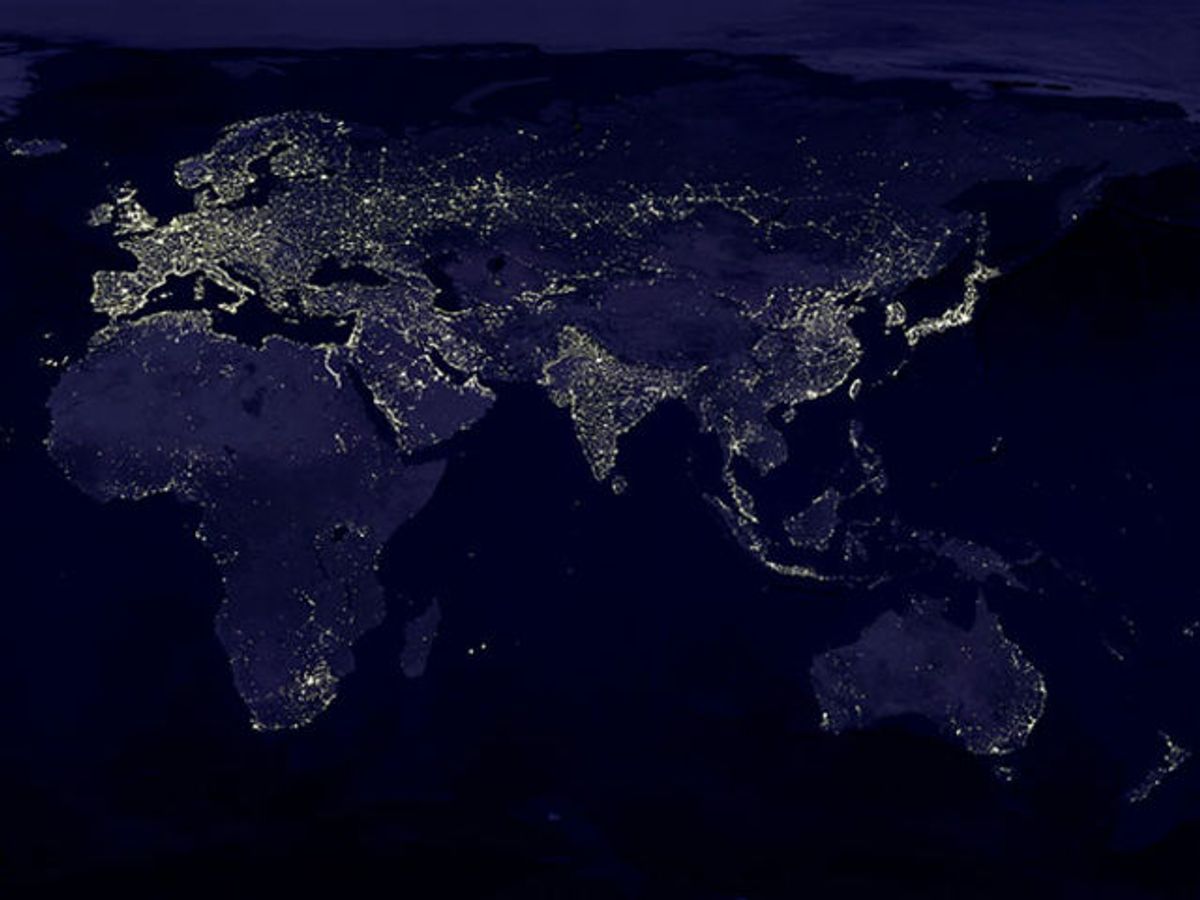
Researchers have recently tried to estimate poverty levels by analyzing mobile phone usage data and satellite photos showing nighttime lighting. But mobile phone data are typically not publicly available. Nighttime lights, meanwhile, indicate wealthier regions, but they cannot differentiate among economic levels in the most impoverished regions. “In the poorest areas in Africa, the ones we care the most about, it’s almost uniformly dark at night,” says Neal Jean, an electrical engineering and computer science Ph.D. student at Stanford University.
Jean, earth system science professor Marshall Burke, and their colleagues came up with a clever machine-learning method that combines nighttime light intensity data with daytime satellite imagery. The technique, reported in the journal Science, is general and could be applied to any developing country, Jean says.
In machine learning, a computer model is fed labeled data sets—say, thousands of images labeled “dog” or “cat.” Much like humans learn by inference after seeing enough examples, the model analyzes certain features in the images and figures out how to classify an animal in a picture as a dog or cat.
The researchers trained their machine-learning algorithm with millions of daytime satellite images, each labeled with a number that corresponded to how bright the area was at night. Daytime images, which contain features that indicate livelihoods, such as paved roads, metal roofs, and farmland, can help distinguish poor regions from ultrapoor ones. “The model looks for visual cues and automatically learns to find features in daytime imagery that correspond to nighttime light values,” Jean says.
Next, the team trains a second computer model to use the subtle differences in the images that are picked out by the first model in cooperation with existing economic survey data. This second model learns to estimate a village’s relative level of poverty—measured by the consumption expenditures in 2011 U.S. dollars and an asset-based wealth index. “So you can take an image of any area and predict how poor that area is,” he says.
Both the daytime satellite images from Google Maps and the nighttime light data from the National Geophysical Data Center are available in high resolution; 1-square-kilometer images can be pulled up for just about any point on the globe. But for the purposes of this research, the Stanford team used satellite and survey data for five countries: Nigeria, Tanzania, Uganda, Malawi, and Rwanda.
The new model more accurately estimated poverty levels than models that used only nighttime light data in areas where the average income was half or even one-third of the poverty level.
New studies would just require training the model with satellite imagery from the regions being evaluated. The team is now trying to use images with different resolutions, which yield different information—say, building density at low-res or roofing material at high-res—to see how having that information affects the accuracy of poverty estimates.
Prachi Patel is a freelance journalist based in Pittsburgh. She writes about energy, biotechnology, materials science, nanotechnology, and computing.


