Patent Power
IEEE Spectrum ranks the world’s most valuable patent portfolios

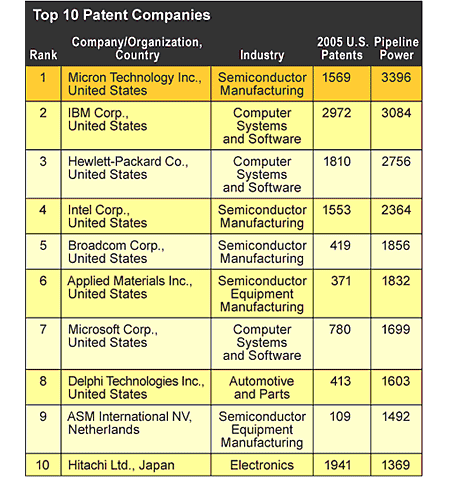
Quality—not quantity—counts when it comes to patent portfolios. For evidence, look no further than Micron Technology, in Boise, Idaho, the world’s second-largest maker of memory chips. Micron logged 1569 U.S. patents in 2005, just over half of IBM’s 2972, for example. Now consider the resonance of those patents: how many other people cited them, how diverse the patent portfolio was, and how that diversity helped nurture and expand the portfolio in recent years. It quickly becomes clear that while IBM’s assemblage yelled, Micron’s roared.
In fact, Micron beat out thousands of organizations, including numerical patent champ IBM, to stake a claim to having the world’s most powerful patent pipeline in IEEE Spectrum’s first annual patent survey [PDF].
The survey was conducted for Spectrum by 1790 Analytics, in Mount Laurel, N.J., a research firm whose specialty is analyzing patent citations. The company considered 1027 organizations with the most influential—and potentially most lucrative—patent portfolios. It found that Micron’s patent portfolio beat out not only IBM’s but also those of such perennial patent powerhouses as Hewlett-Packard, Intel, and Microsoft. All in all, it was a pretty sweet victory for a company whose US $603 million R&D budget last year was roughly one-tenth the size of IBM’s—not even big enough to crack the top 100 R&D companies.
How did Micron come out on top as the leader in patent portfolios? Basically, by patenting innovations that frequently led to further innovations, both inside and outside of Micron. In determining the overall strength of a company’s portfolio, 1790 Analytics’ methodology goes beyond patent counts to emphasize how frequently a company’s patents are cited by other patents.
While the survey considers innovative companies worldwide, it is based only on those companies’ U.S. patents—for two reasons. First, citation metrics based on U.S. patents tend to be more robust, because most of their citations are to other U.S. patents. In contrast, many citations in patents from, say, the European Patent Office are to patents from specific national systems rather than to other EPO patents. Second, most large organizations, regardless of where they are headquartered, patent many if not most of their inventions in the United States.
Although the data aren’t meant to support comparisons of the relative innovative prowess of different countries, some conclusions are hard to avoid. The United States was the home base of the largest number of companies in the survey, at 175. These companies dominated biotechnology and pharmaceuticals, semiconductor manufacturing, and computer systems and software, with some 15 014 patents in those sectors. Companies based in Japan formed the second largest group, 45 in all, and they dominated electronics, with 6850 patents. Other countries represented in the survey include Canada, Finland, France, Germany, India, Italy, Korea, the Netherlands, Sweden, Switzerland, Taiwan, and the United Kingdom.
To derive a company’s PIPELINE POWER score, 1790 Analytics first counted the number of U.S. patents the company obtained last year. To avoid statistical anomalies, only companies that were awarded 25 or more patents in 2005 made the cut. The research firm then multiplied the company’s patent count by the product of four variables that it calls Pipeline Growth, Pipeline Impact, Pipeline Generality, and Pipeline Originality. (The Power score is based on the precise variable values, which have been rounded off on the printed table.)
Growth simply measures the rate at which a company obtains patents over time. But to assess the relative impact of patents on other patents based on citations, 1790 Analytics created a scoring scale for Impact, Generality, and Originality. To do so, the company determined the average score for an indicator for all patents from the same year and technology class and assigned that average a value of 1.0. Indicator scores above 1.0 show organizations whose patents perform better than expected on a given metric. Values below 1.0 show organizations whose patents perform worse than expected. For example, Intel’s Pipeline Impact of 1.24 shows that its patents are cited 24 percent more frequently than expected.
Each of the four indicators that figure into the Pipeline Power score is described in more detail below:
PIPELINE GROWTH shows the trend in an organization’s patent activity by dividing the number of patents obtained in 2005 by the annual average for the years 2000 through 2004. For example, if a company averaged 100 patents per year between 2000 and 2004 and was granted 125 patents last year, its Pipeline Growth for 2005 would be 1.25.
PIPELINE IMPACT shows how frequently patents issued in 2005 cite a company’s patents issued from 2000 through 2004. This metric is based on citations both from the organization itself and from other organizations. It reflects both the extent to which a company is developing its own technology and the impact of its technology on others in the industry.
PIPELINE GENERALITY measures the variety of technologies that build upon an organization’s patents. This metric is based on the notion that patents cited by later patents from many different fields tend to have more general application than patents cited only by later patents from the same field. For example, a patent for a new composite material is likely to be cited by a broader range of technologies than a patent for a new mousetrap, which is likely to be cited only by other mousetrap patents.
PIPELINE ORIGINALITY measures the variety of technologies upon which an organization’s patents build, based on the concept that inventions created by combining ideas from several different technologies tend to be more original than those that make incremental improvements upon the same technology. For instance, a patent for a semiconductor device with a metal gate electrode that refers only to earlier semiconductor manufacturing patents will have a low originality score. In contrast, a reduced substrate microelectromechanical systems (MEMS) device that refers to earlier patents from numerous technologies, such as semiconductors, fuel cells, transducers, and other MEMS devices, will have a higher originality value.
You can see the complete survey, which includes all the top companies in each of 15 industries, by visiting /nov06/patentsurvey
For those of you wondering where 1790 Analytics got its name: 1790 is the year in which the first U.S. patent was issued, to Samuel Hopkins for a method of making potash. As our survey shows, more than two centuries and 7 million patents later, inventors are building on each other’s work to promote the progress of science and the useful arts and, they hope, their bank accounts, too.
