The Conversation (0)

Closed for Business: The streets of Manhattan are quiet on 10 April as most people comply with the city’s self-quarantine rules.
Photo: Spencer Platt/Getty Images
As we write these words, several billion people, the majority of the world’s population, are confined to their homes or subject to physical-distancing policies in an attempt to contain one of the worst pandemics of modern times. Economic activity has plummeted, countless people are out of work, and entire industries have ground to a halt.
Quite understandably, a couple of questions are on everyone’s mind: What is the exit strategy? How will we know when it’s safe to implement it?
Around the globe, epidemiologists, statisticians, biologists, and health officials are grappling with these questions. Though engineering perspectives are uncommon in epidemiological modeling, we believe that in this case public officials could greatly benefit from one. Of course, the COVID-19 pandemic isn’t an obvious or typical engineering problem. But in its basic behavior it is an unstable, open-loop system. Left alone, it grows exponentially, as we have all been told repeatedly. However, there’s good news, too: Like many such systems, it can be stabilized effectively and efficiently by applying the principles of control theory, most notably the use of feedback.
Inspired by the important work of epidemiologists and others on the front lines of this global crisis, we have explored how feedback can help stabilize and diminish the rate of propagation of this deadly virus that now literally plagues us. We’ve drawn on proven engineering principles to come up with an approach that would offer policymakers concrete guidance, one that takes into account both medical and socioeconomic considerations. We relied on feedback-based mechanisms to devise a system that would bring the outbreak under control and then adeptly manage the longer-term caseload.
It is during this longer-term phase, the inevitable relaxing of physical distancing that is required for a functioning society, that the strengths of a response grounded in control theory are most crucial. Using one of the widely available computer models of the disease, we tested our proposal and found that it could help officials manage the enormous complexity of trade-offs and unknowns that they will face, while saving perhaps hundreds of thousands of lives.
Our goal here is to share some of our key findings and to engage a community of control experts in this vital and fascinating problem. Together, we can contribute vitally to the international efforts to manage this outbreak.
 The Woman in the Window: Having tested positive for the novel coronavirus, Marietta Diaz self-quarantines in her Florida home on 23 March.Photo: Zak Bennet/AFP/Getty Images
The COVID-19 pandemic is unlike any other recent disease outbreak for several reasons. One is that its basic reproduction number, or R0 (“R naught”), is relatively high. R0 is an indication of how many people, on average, an infected person will infect during the course of her illness. R0 is not a fixed number, depending as it does on such factors as the density of a community, the general health of its populace, its medical infrastructure and resources, and countless details of the community’s response. But a commonly cited R0 figure for ordinary seasonal influenza is 1.3, whereas a figure calculated for the experience in Wuhan, China, where COVID-19 is understood to have originated, is 2.6 [PDF]. Figures for some outbreaks in Italy range from 2.76 to 3.25 [PDF].
The goal of infectious-disease intervention is reducing the R0 to below 1, because such a value means that new infections are in decline and will eventually reach zero. But with the COVID-19 outbreak, the level of urgency is extraordinarily high due to the disease’s relatively high fatality rate. Fatality rates, too, are quite variable and depend on such factors as age, physical fitness, present pathologies, region, and access to health care. But in general they are much higher for COVID-19 than for ordinary influenza. A surprisingly large percentage of people who contract the disease develop a form of viral pneumonia that sometimes proves fatal. Many of those patients require artificial ventilation, and if their number exceeds the capacity of intensive care units to accommodate them, some number of them, perhaps a majority, will die.
For that reason, enormous worldwide efforts have focused on “flattening the curve” of infections against time. A high, sharp curve indicating a surge of infections in a short time period, as occurred in China, Italy, Spain, and elsewhere, means that the number of serious cases will swamp the ability of hospitals to treat them and result in mass fatalities. So to reduce the peak demand on health care, the first priority must be to bring the caseload under control. Once that’s done, the emphasis shifts to managing a long-term return to normalcy while minimizing both death rates and economic impact.
The two basic approaches to controlling the spread of disease are mitigation, which focuses on slowing but not necessarily stopping the spread, and suppression, which aims to reverse epidemic growth. For mitigation, R0 is reduced but remains greater than 1, while for suppression, R0 is smaller than 1. Both obviously require changing R0. Officials accomplish that by introducing social measures such as restricted travel, home confinement, social distancing, and so on. These restrictions are referred to as nonpharmaceutical interventions, or NPIs. What we are proposing is a systematically designed strategy, based on feedback, to change R0 through modulation of NPIs. In effect, the strategy alternates between suppression and mitigation in order to maintain the spread at a desired level.
It may sound straightforward, but there are many challenges. Some of them arise from the fact that COVID-19 is a very peculiar disease. Despite enormous efforts to characterize the virus, biologists still do not understand why some people experience fairly mild symptoms while others spiral into a massive, uncontrolled immune response and death. And no one can explain why, among fatalities, men predominate. Other mysteries include the disease’s long incubation period—up to 14 days between infection and symptoms—and even the question of whether a person can get re-infected.
These perplexities have helped bog down efforts to deal with the pandemic. As a recent Imperial College research paper [PDF] notes: “There are very large uncertainties around the transmission of this virus, the likely effectiveness of different policies, and the extent to which the population spontaneously adopts risk reducing behaviours.” Consider the long incubation time and apparent spreading of the virus before symptoms are experienced. These undoubtedly contributed to the relatively high R0 values, because people who were infectious continued to interact with others and transmitted the virus without being aware that they were doing so.
This lag before the onset of symptoms corresponds to time delay in control-system theory. It is notorious for introducing oscillations into closed-loop systems, particularly when combined with substantial uncertainty in the model itself.
In addition to delays, there are very significant uncertainties. Testing, for example, has been spotty in some countries, and that inconsistency has obscured the number of actual cases. That, in turn, made it impossible for officials to know the true level of contagion. Even NPIs are not immutable. The extent to which the public is complying with policies is never 100 percent and may not even be knowable with a high degree of accuracy; people may follow directives less strictly over time. Also, health care capacity can go up because of an increase in available beds due to capacity additions, or down because of a decrease due to a natural disaster.
The point is, a pandemic is a dynamic, fast-moving situation, and inadequate local attempts to monitor and control it can be disastrous. In the Spanish flu pandemic of 1918, cities took widely varying approaches to the lockdown and release of their citizens, with wildly varying results. Some recovered straightforwardly, others had rebound spikes larger than the initial outbreak, and still others had multiple outbreaks after the initial lockdown.
 Stocking Up: Shoppers wait their turn to buy groceries at a Wegmans supermarket in Brooklyn, N.Y., on 7 April.Photo: Stephanie Keith/Bloomberg/Getty Images
A commonly cited proposal for relaxing social-distancing measures is an on-off approach, where some restrictions are lifted when the number of new cases requiring intensive care is below a threshold and are put back into place when it exceeds a certain number. The research paper [PDF] by the Imperial College COVID-19 Response Team showed how such a strategy is “robust to uncertainty in both the reproduction number, R0, and in the severity of the virus” and offers “greater robustness to uncertainty than fixed duration interventions and can be adapted for regional use.”
This on-off approach is an example of the use of feedback, where the feedback variable is the number of cases in hospital intensive care units. A major drawback of this type of on-off control is that it can lead to oscillations—which, if this strategy is too aggressive, may overwhelm the capacity of the health care system to treat serious cases.
A major advantage of feedback here is that it lessens the impact of model uncertainty—meaning that if carefully designed, a strategy can be effective even if the models it is based on are not accurate. We do not yet have an accurate epidemiological model of COVID-19 and will likely not have one for at least several months, if at all. Furthermore, the physical distancing and confinement regimes that have been put into place are new, so we don’t really know yet exactly how effective they’ll be or even the extent to which people are complying with them.
In the absence of widespread immunity or vaccination, the only way to suppress the disease is total confinement—obviously not a viable long-term solution. A reasonable middle ground is to implement a feedback policy designed to keep R0 close to 1, with perhaps small oscillations on either side. In so doing we would maintain the critical caseload within the capacity of health care institutions while slowly and safely building immunity in our communities, and returning to normal social and economic conditions as quickly as is safely possible.
A key point is that the design of the policy be rigorous from a control-engineering viewpoint while remaining comprehensible to epidemiologists, policymakers, and others without deep knowledge of control theory. It should also be capable of generating restriction regimes that can be translated into practical public policies. If the tuning mechanism is too aggressive—for example, switching between full and zero social distancing—it will lead to severe oscillations and overwhelmed hospitals, and very likely frustration and social-distancing fatigue among the people who need to follow dramatically changing rules.
On the other hand, tuning that is too timid also courts fiasco. An example of such tuning might be a policy requiring a full month in which no new cases are recorded before officials relax restrictions. Such a hypercautious approach risks needlessly prolonging the pandemic’s economic devastation, creating a catastrophe of a different sort.
But a properly designed feedback-based policy that takes into account both dynamics and uncertainty can deliver a stable result while keeping the hospitalization rate within a desired approximate range. Furthermore, keeping the rate within such a range for a prolonged period allows a society to slowly and safely increase the percentage of people who have some sort of antibodies to the disease because they have either suffered it or they have been vaccinated—preferably the latter.
Eventually, as the percentage of the population who have suffered the disease and recovered from it becomes high enough, the number of susceptible people becomes small enough that the virus’s rate of spread is naturally lowered. This phenomenon is called herd immunity, and it is how pandemics have generally died out in the past. However, the question of whether or how such immunity to COVID-19 can be built up is still under investigation, which makes it particularly important to monitor and manage nonpharmaceutical interventions as a function of the actual spread of the virus and of hospitalization rates.
In designing our control system, we relied strongly on the fact that most nonpharmaceutical interventions are not binary, on-off quantities but instead can take on a range of values and can be implemented that way by policymakers. For example, stay-at-home directives can be applied disproportionately to specific groups of people who are particularly at risk because of age or a preexisting health condition. Then the number of people who are affected by the directive can be increased or decreased by simply changing the guidelines on who is “at risk.” We can similarly widen or narrow the definition of people who are designated “essential” and are therefore exempt from the directives. Public meetings, too, may be banned for n participants, where the value of n can be increased as things loosen up.
Restrictions on travel, too, can be quite variable. Full lockdown limits people to moving within the boundaries of their property. But as conditions improve, officials might grant access to businesses within a couple, and then perhaps a dozen, kilometers of their home, and so on. These are all obviously important levers.
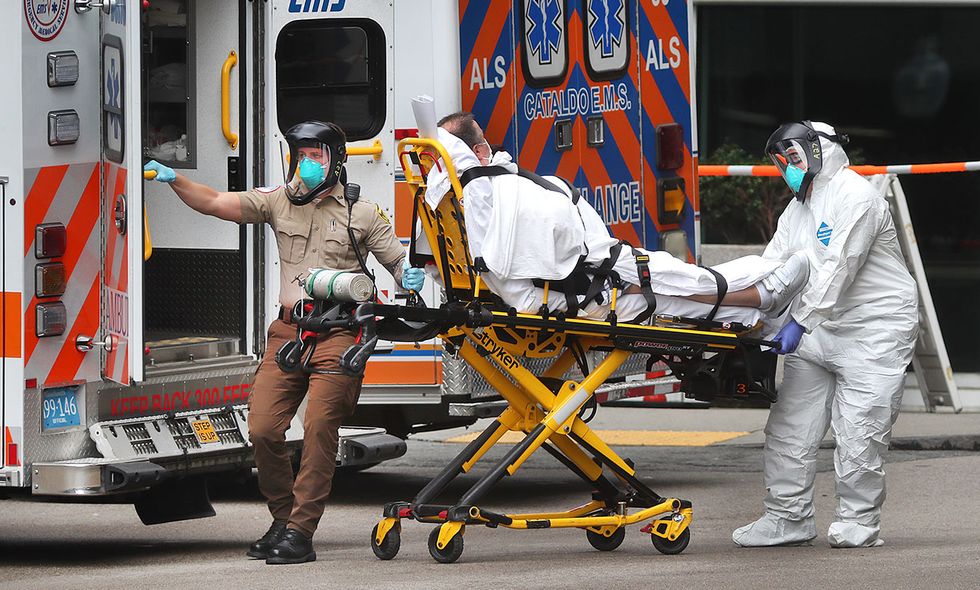 Fast Lane: An ambulance crew delivers a patient to Massachusetts General Hospital in Boston on 8 April.Photo: John Tlumacki/The Boston Globe/Getty Images
To explore how such variability can save lives, we devised a series of scenarios, each indicative of a recovery strategy with a different level of feedback, and simulated the resulting policies against a commonly used infectious-disease computer model. We plotted the results in a series of graphs showing COVID-19 hospital cases as a function of time. Hospital occupancy may be a more reliable and tangible measure than total case count, which depends on extensive testing that many countries (such as the United States) do not have at the moment. Furthermore, hospital ICU bed occupancy or ventilator availability is arguably an important measure of the ability of the local health care system to treat those who are suffering from respiratory distress acute enough to require intensive care and perhaps assisted breathing.
The model we used was created by Jeffrey Kantor, professor of chemical engineering at the University of Notre Dame (Kantor’s model is available on GitHub). The model assumes we can suppress disease transmission to a very low level by choosing appropriate policy levers. Although worldwide experience with COVID-19 is still limited, at the time of this writing this assumption appears to be a realistic one.
To make the model more reflective of our current understanding of COVID-19, we added two types of uncertainty. We assumed different values of R0 to see how they affected outcomes. To consider how noncompliance with nonpharmaceutical interventions would affect results, we programmed for a range of effectiveness of these NPIs.
Our first, simplest simulation confirms what we all know by now, which is that not doing anything was not an option [Figure 1].
Curve of Death
Figure 1
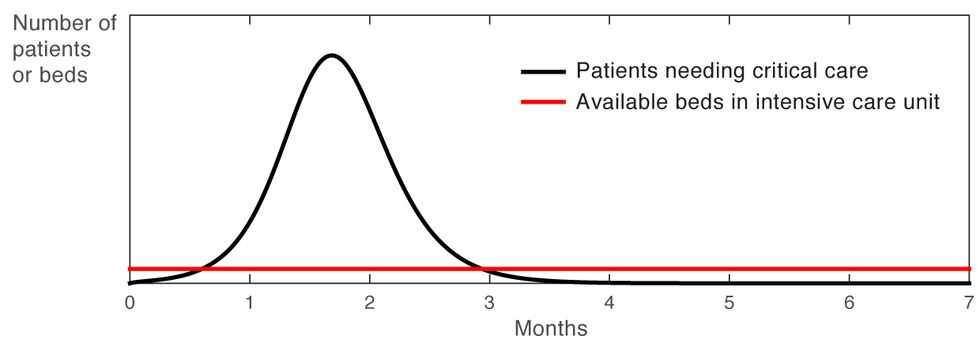 Failing to respond to the outbreak of a deadly and highly contagious illness results in a sharp spike of serious cases that overwhelms the capacity of local hospitals.Source: G. Stewart, K. van Heusden, and G.A. Dumont/University of British Columbia, Vancouver
The large and lengthy peak well above the available bed capacity in the intensive care unit indicates a huge number of cases that will likely result in death. This is why, of course, most countries have put aggressive measures in place to flatten the curve.
So what do we do when the number of infections comes down? As this second simulation clearly shows [Figure 2], relaxing all restrictions when the number of infections has come down will only lead to a second surge in infections. Not only could this second surge overwhelm our hospitals, it could also lead to an even higher mortality rate than the first surge, as occurred repeatedly in several U.S. cities during the Spanish flu epidemic of 1918.
Second Surge
Figure 2
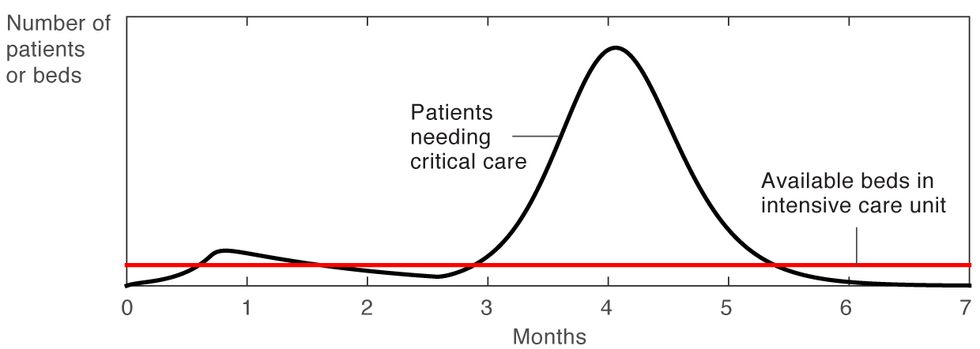 Relaxing all restrictions after the number of cases drops to a very low level leads to another cycle of infection, whose peak can be even higher than that of the first cycle.Source: G. Stewart, K. van Heusden, and G.A. Dumont/University of British Columbia, Vancouver
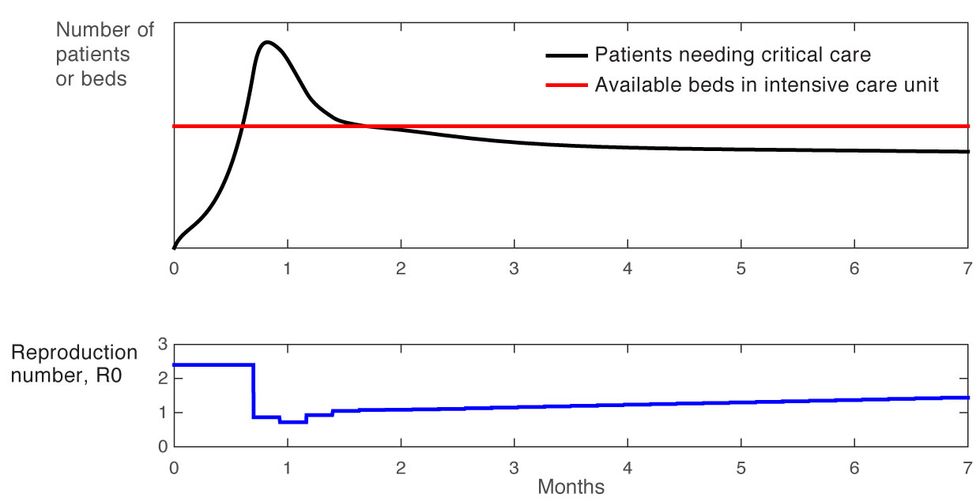
Now let’s consider the simple on-off approach to confinement, in which most of the usual restrictions on gatherings, travel, and social interaction are lifted entirely when the number of new ICU cases drops below a lower threshold, and then are put back into place when this number exceeds a higher threshold. In this case, the R0 swings sharply between two levels, a high above 2 and a low below 1, as shown in blue in the graph [Figure 3]. This approach leads to oscillations, and if it is applied too aggressively, the high points of these oscillations will exceed the health care system’s capacity to treat patients. Another likely problem with this approach has been labeled “social distance fatigue.” People become weary of the repeated changes to their routine—going back to work for a couple of weeks, then being told to stay at home for a few weeks, then given the all-clear to go back to work, and so on.
An On-Off Approach
Figure 3
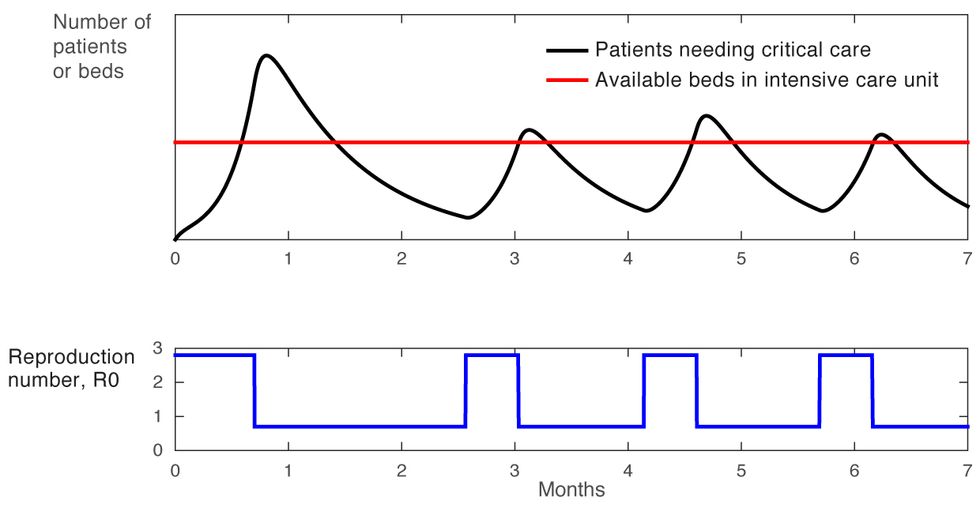 Imposing and lifting strong social restrictions causes abrupt swings in the basic reproduction number, R0 (in blue, above). Those swings in turn lead to oscillations in the caseload (black, upper graph), which can exceed the capacity of local hospitals (red).Source: G. Stewart, K. van Heusden, and G.A. Dumont/University of British Columbia, Vancouver
We can do better. For our third experiment, we developed a scenario in which we targeted 90 percent occupancy of hospital intensive care units. To achieve this, we designed a simple feedback-based policy using the principles of control systems theory.
When R0 is high, many restrictions are put into place. People are largely confined to their homes and services are limited to the bare minimum needed for society to function—utilities, police, sanitation, and food distribution, for example. Then, as conditions begin to improve, as revealed by our feedback measure of hospital-bed occupancy, other services are gradually phased in. Recovered people are allowed to move freely as they can no longer contract, or transmit, the virus. Perhaps people are allowed to visit restaurants within walking distance, some small businesses are allowed to reopen under certain conditions, or certain age groups are subject to less-stringent restrictions. Then geographical mobility might be loosened in other ways. The point is that restrictions are eased gradually, with each new gradation based carefully on feedback.
This strategy results in a stable response that maximizes the rate of recovery. Furthermore, the demand for hospital ICU beds never exceeds a threshold, thanks to a “set point” target below that threshold [Figure 4]. The health care capacity limit is never breached. In addition, note the general upward trend for the release of restrictions, as the number of recovered and immune people grows and nonpharmaceutical interventions are gradually phased out.
Systematic Approach
Figure 4
 A response based on control-theory principles strives to keep the basic reproduction number, R0, close to 1, as shown above (in blue). As the caseload comes down, officials use feedback painstakingly to ease restrictions and control R0 so that it very gradually approaches 1, perhaps slightly and briefly exceeding it from time to time. As shown in the upper graph, this strategy keeps the caseload within the capacity of the local health care system to accommodate it indefinitely.Source: G. Stewart, K. van Heusden, and G.A. Dumont/University of British Columbia, Vancouver
This simplified example shows how using feedback to modulate the restrictions imposed on a population to modify R0 leads to a policy that is robust. For example, early on in the outbreak, there will be a great deal of uncertainty about R0 because testing will still be spotty, and because an unknown number of people may have the disease without realizing it. That uncertainty will inevitably fuel a surge in initial cases. However, once the case count is stabilized by the initial restrictive regime, a policy based on feedback will prove very tolerant of variations in R0, as illustrated in Figure 5. As the graph shows, after a few months it doesn’t matter whether the R0 is 2 or 2.6 because the total case count stays well below the number of available hospital beds due to the use of feedback.
The Beauty of Feedback
Figure 5
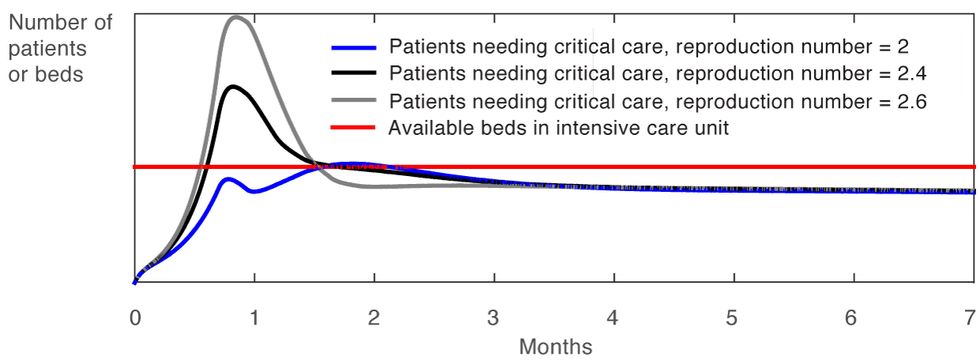 In real-world scenarios, officials will typically have only an approximate value for the basic reproduction number, R0. In the long run, however, this uncertainty won’t matter. For R0s between 2.0 (blue) and 2.6 (gray), the caseload stabilizes at an acceptable level within a couple of months as a result of feedback from actual hospital conditions.Source: G. Stewart, K. van Heusden, and G.A. Dumont/University of British Columbia, Vancouver
As an added benefit, using feedback makes the policy effective even in the face of likely degrees of noncompliance. In practice, what noncompliance means is that a given level of restrictions will result in an R0 that is slightly higher than expected, which in turn causes fluctuations in the number of people who are infected. Noncompliance might, for instance, result in the restrictions being 10 percent less effective than intended [Figure 6]. However, through feedback, the policy will automatically tighten to compensate.
Compliance Conundrum
Figure 6
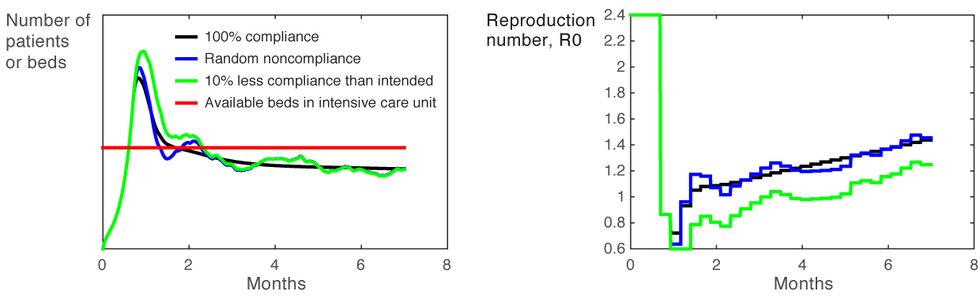 Officials can never know the exact extent to which people are disregarding their restrictions. But if their policies are based closely on feedback, realistic levels of noncompliance won’t cause anything more than minor deviations from the expected levels of illness.Source: G. Stewart, K. van Heusden, and G.A. Dumont/University of British Columbia, Vancouver
In reality, various factors that the model treats as invariable, such as health care capacity, might be anything but. However, variations of this sort can typically be accommodated in a policy, for example by changing the threshold on ICU occupancy.
Clearly, tried-and-true principles of control theory, particularly feedback, can help officials plot more robust and optimal strategies as they attempt to deal with the devastating COVID-19 pandemic. But how to make officials aware of these powerful tools?
Imagine an online interactive tool offering detailed, specific guidance in plain language and aimed at public officials and others charged with mounting a response to the pandemic in their communities. The guidance would be based on strategies developed by a small group of control theorists, epidemiologists, and people with policy experience. The site could review the now-familiar initial response, in which nonessential workers are confined to their homes except for essential needs. Then the site could go on to give some guidance on how and when the tightest restrictions could be lifted.
The biggest challenge to the designers of this Web-based tool will be enabling nonspecialists to visualize how the various components of the epidemiological model interact with the various feedback policy options and model uncertainty. How exactly should the main feedback measure—likely some aspect of hospital or intensive care occupancy—be implemented? Which restrictions should be lifted in the first round of easing? How should they be eased in the first round? In the second round? While monitoring the feedback measure, how frequently should officials consider whether to implement another round of easing? Feedback will help officials determine when to time various phases of interventions. An interactive tool that could assess different policy approaches, illustrating what conditions must be in place to alleviate uncertainty and shrink the projected caseload, would be very valuable indeed.
Working with political officials, epidemiologists, and others, control engineers can systematically design policies that take these constraints and trade-offs into account. It comes down to this: In the many months of struggle ahead, such a collaboration could save countless lives.
Editor’s note: Material in this article originally appeared as a post on Medium, “Coronavirus: Policy Design for Stable Population Recovery,” and in several other venues.
About the Authors
Greg Stewart is vice president of data science for the agriculture technology startup Ecoation and an adjunct professor at the University of British Columbia, in Vancouver. A Fellow of the IEEE, he has led the research, development, and deployment of control and machine-learning technology in such applications as microalgae cultivation, large-scale data centers, automotive power-train control, and semiconductor fabrication. He is currently developing models and strategies for controlling the spread of pests and disease in agriculture.
Klaske van Heusden is a research associate at the University of British Columbia in Vancouver. An IEEE Senior Member, her research interests include modeling, prediction, and control, with applications in medical devices, mechatronics, and robotics. Lately she has been working on a robust and provably safe automated drug-delivery device for use in operating rooms.
Guy A. Dumont is a professor of electrical and computer engineering at the University of British Columbia in Vancouver and a principal investigator at BC Children’s Hospital Research Institute. An IEEE Fellow, he has 40 years of experience applying advanced control theory in the process industries, in particular pulp and paper and, for the last 20 years, in biomedical applications such as automated drug delivery for closed-loop control of anesthesia.
To Probe Further: References
“Coronavirus: Why You Must Act Now,” Medium, by Tomas Pueyo
“Coronavirus: The Hammer and the Dance,” Medium, by Tomas Pueyo
Impact of Non-Pharmaceutical Interventions (NPIs) to Reduce COVID-19 Mortality and Healthcare Demand [PDF], by the Imperial College COVID-19 Response Team
Potential Long-Term Intervention Strategies for COVID-19, GitHub, by Marissa Childs, Morgan Kain, Devin Kirk, Mallory Harris, Jacob Ritchie, Lisa Couper, Isabel Delwel, Nicole Nova, Erin Mordecai
“When Can We Let Up? Health Experts Craft Strategies to Safely Relax Coronavirus Lockdowns,” Stat, by Sharon Begley
“How Some Cities ‘Flattened the Curve’ During the 1918 Flu Pandemic,” National Geographic, by Nina Strochlic and Riley D. Champine
“First-Wave COVID-19 Transmissibility and Severity in China Outside Hubei After Control Measures, and Second-Wave Scenario Planning: A Modelling Impact Assessment,” The Lancet, by Kathy Leung, Joseph T. Wu, Di Liu, Gabriel M. Leung
From Your Site Articles


