Fossil-fuel power plants are one of the largest emitters of the greenhouse gases that cause climate change. Collectively, these 18,000 or so plants account for 30 percent of global greenhouse gas emissions, including an estimated 15 billion metric tons of carbon dioxide per year. The pollutants produced by burning fossil fuels also seriously degrade air quality and public health. They contribute to heart and respiratory diseases and lung cancer and are responsible for nearly 1 in 10 deaths worldwide.
Averting the most severe impacts of air pollution and climate change requires understanding the sources of emissions. The technology exists to measure CO2 and other gases in the atmosphere, but not with enough granularity to pinpoint who emitted what and how much. Last month, a new initiative called Climate TRACE was unveiled, with the aim of accurately tracking man-made CO2 emissions right to the source, no matter where in the world that source is. The coalition of nine organizations and former U.S. Vice President Al Gore has already begun to track such emissions across seven sectors, including electricity, transportation, and forest fires.
I’m a machine-learning researcher, and in conjunction with the nonprofits WattTime, Carbon Tracker, and the World Resources Institute (with funding from Google.org), I’m working on the electricity piece of Climate TRACE. Using existing satellite imagery and artificial intelligence, we’ll soon be able to estimate emissions from every fossil-fuel power plant in the world. Here’s how we’re doing it.
The current limits of monitoring emissions from space
The United States is one of the few countries that publicly releases high-resolution data on emissions from individual power plants. Every major U.S. plant has on-site emissions monitoring equipment and reports data to the Environmental Protection Agency. But the costs of installing and maintaining these systems make them impractical for use in many countries. Monitoring systems can also be tampered with. Other countries report annual emissions totals that may be rough estimates instead of actual measurements. These estimates lack verification, and they may under-report emissions.
Greenhouse gas emissions are surprisingly difficult to estimate. For one thing, not all of it is man-made. CO2 and methane releases from the ocean, volcanoes, decomposition, and soil, plant, and animal respiration also put greenhouse gases into the atmosphere. Then there are the non-obvious man-made contributors such as cement production and fertilizers. Even if you know the source, it can be tricky to estimate quantities because the emissions fluctuate. Power plants burning fossil fuels adjust their generation depending on local demand and electricity prices, among other factors.
Concentrations of CO2 are measured locally at observatories such as Mauna Loa, in Hawaii, and globally by satellites such as NASA’s OCO-2. Rather than directly measuring the concentration, satellites estimate it based on how much of the sunlight reflected from Earth is absorbed by carbon dioxide molecules in the air. The European Space Agency’s Sentinel-5P uses similar technology for measuring other greenhouse gases. These spectral measurements are great for creating regional maps of atmospheric CO2 concentrations. Such regional estimates have been particularly revealing during the pandemic, as stay-at-home orders led to decreased pollutants reported around cities, largely driven by decreases in transportation.
But the resolution of these measurements is too low. Each measurement from OCO-2, for example, represents a 1.1-square-mile (2.9-square-kilometer) area on the ground, so it can’t reveal how much an individual power plant emitted (not to mention CO2 from natural sources in the area). OCO-2 provides daily observations of each location, but with a great deal of noise due to clouds, wind, and other atmospheric changes. To get a reliable signal and suppress noisy data points, multiple observations of the same site should be averaged over a month.
To estimate emissions at the source, we need both spatial resolution that’s high enough to see plant operations and frequent observations to see how those measurements change over time.
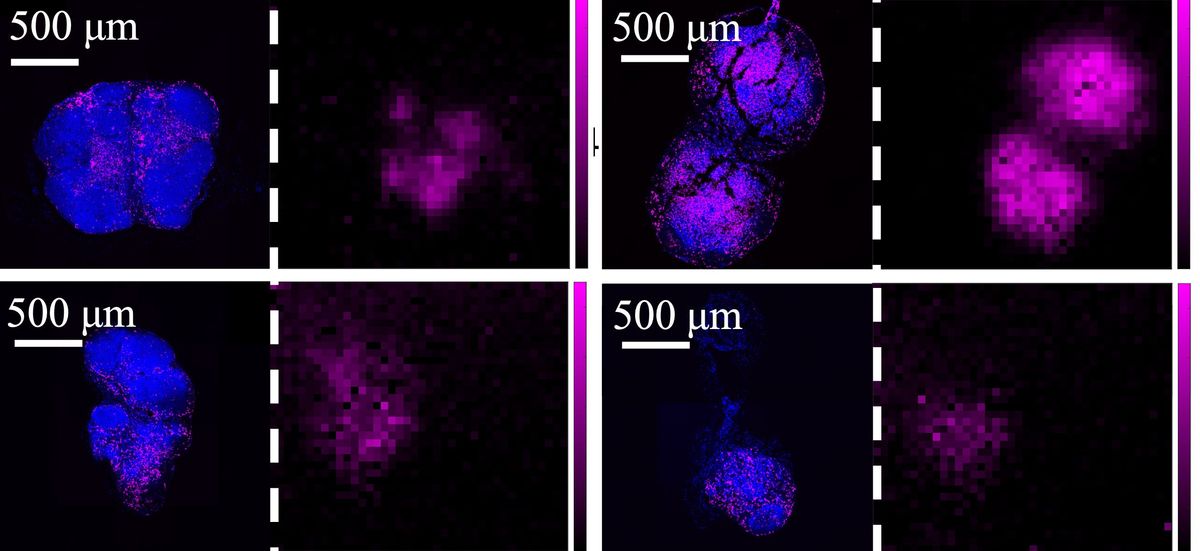
 These images from the European Space Agency’s Copernicus Sentinel satellite network show smoke and water vapor plumes when this power plant is operating.Images: European Space Agency
How to model power plant emissions with AI
We’re fortunate that at any given moment, dozens of satellite networks and hundreds of satellites are capturing the kind of high-resolution imagery we need. Most of these Earth-observing satellites observe in the visible spectrum. We also use thermal infrared to detect heat signatures.
Having human analysts review images from multiple satellites and cross-referencing them with other data would be too time-consuming, expensive, and error-prone. Our prototype system is starting with data from three satellite networks, from which we collect about 5,000 non-cloudy images per day. The number of images will grow as we incorporate data from additional satellites. Some observations contain information at multiple wavelengths, which means even more data to be analyzed and requiring a finely tuned eye to interpret accurately. No human team could process that much data within a reasonable time frame.
With AI, the game has changed. Using the same deep-learning approach being applied to speech recognition and to obstacle avoidance in self-driving cars, we’re creating algorithms that lead to much faster prediction of emissions and an enhanced ability to extract patterns from satellite images at multiple wavelengths. The exact patterns the algorithm learns are dependent on the type of satellite and the power plant’s technology.
We start by matching historical satellite images with plant-reported power generation to create machine-learning models that can learn the relationship between them. Given a novel image of a plant, the model can then predict the plant’s power generation and emissions.
We have enough ground truth on power generation to train the models. The United States and Taiwan are two of the few countries that report both plant emissions and power generation at hourly intervals. Australia and countries in Europe report generation only, while still other countries report daily aggregated generation. Knowing the power generation and fuel type, we can estimate emissions where that data isn’t reported.
Once our models have been trained on plants with known power generation, we can apply the models worldwide to any power plant. Our algorithms create predictive models for various satellites and various types of power plants, and we can aggregate the predictions to estimate emissions over a period of time—say, one month.
What our deep-learning models look for in satellite images
In a typical fossil-fuel power plant, greenhouse gases exhaust through a chimney called the flue stack, producing a telltale smoke plume that our models can spot. Plants that are more efficient or have secondary collection measures to reduce emissions may have plumes that are difficult to see. In those cases, our models look for other visual and thermal indicators when the power plant’s characteristics are known.
Another sign the models look for is cooling. Fossil-fuel plants burn fuel to boil water that creates steam to spin a turbine that generates electricity. The steam must then be cooled back into water so that it can be reused to produce more electricity. Depending on the type of cooling technology, a large water vapor plume may be produced from cooling towers, or heat may be released as warm water discharged to a nearby source. We use both visible and thermal imaging to quantify these signals.
Applying our deep-learning models to power plant emissions worldwide
So far, we have created and validated an initial set of models for coal-burning plants using generation data from the United States and Europe. Our cross-disciplinary team of scientists and engineers continues to gather and analyze ground-truth data for other countries. As we begin to test our models globally, we will also validate them against reported annual country totals and fuel consumption data. We are starting with CO2 emissions but hope to expand to other greenhouse gases.
Our goal is global coverage of fossil-fuel power plant emissions—that is, for any fossil fuel plant in any country, we will be able to accurately predict its emissions of greenhouse gases. Our work for the energy sector is not happening in isolation. Climate TRACE grew out of our project on power plants, and it now has a goal to cover 95 percent of man-made greenhouse gas emissions in every sector by mid-2021.
What comes next? We will make the emissions data public. Renewable energy developers will be able to use it to pinpoint locations where new wind or solar farms will have the most impact. Regulatory agencies will be able to create and enforce new environmental policy. Individual citizens can see how much their local power plants are contributing to climate change. And it may even help track progress toward the Paris Agreement on climate, which is set to be renegotiated in 2021.
About the Author
Heather D. Couture is the founder of the machine-learning consulting firm Pixel Scientia Labs, which guides R&D teams to fight cancer and climate change more successfully with AI.