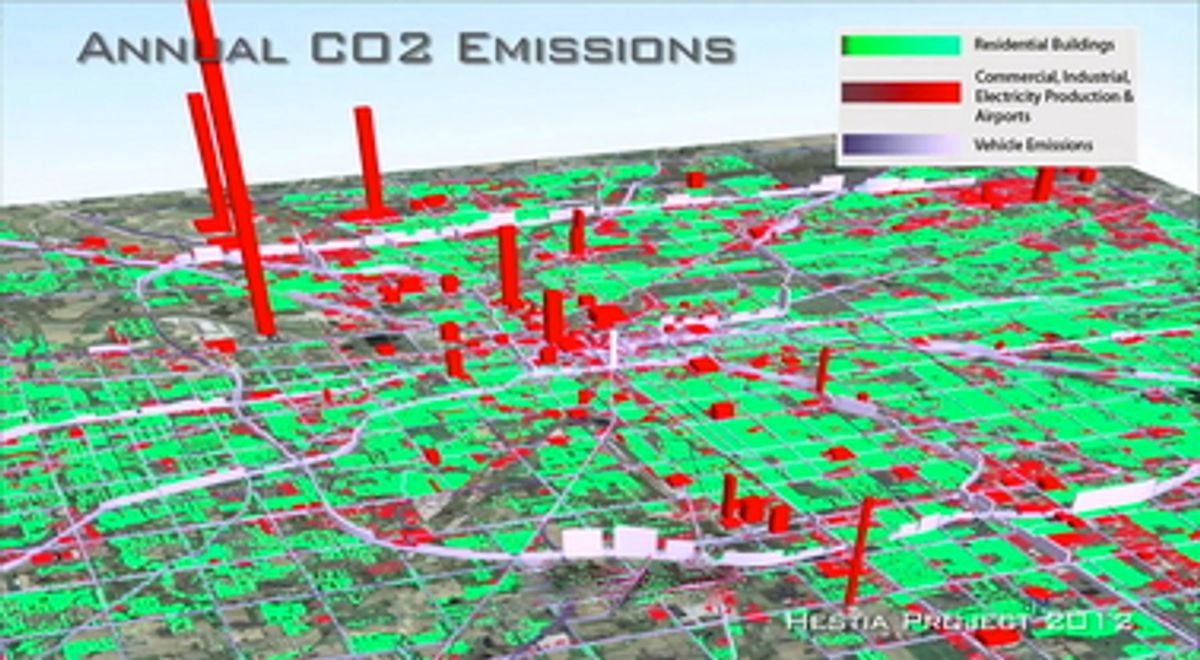
Consider the software unveiled this month by researchers at Arizona State University, which estimates GHG emissions in cities at the level of individual road segments and buildings. According to their report in the journalEnvironmental Science and Technology, the system mines public databases for broader statistics on energy use, local air pollution and traffic flows, then feeds those to traffic simulators and a set of building-by-building energy-consumption models. The resulting high-resolution maps present GHG emissions in a format that's both useful to policymakers and comprehensible to the public.
“Cities have had little information with which to guide reductions in greenhouse gas emissions—and you can’t reduce what you can’t measure,” says Kevin Gurney, a senior scientist with ASU's Global Institute of Sustainability. “We can provide cities with a complete, three-dimensional picture of where, when and how carbon dioxide emissions are occurring.”
So far, maps for Indianapolis are complete and work is ongoing for Los Angeles and Phoenix. Ultimately the scientists hope to map CO2 emissions for all major cities across the United States.
ASU's effort to pinpoint emissions is part of a broader trend that I profiled in July for Earthzine, an online Earth observation journal, earlier this year. I noted a forerunner to ASU's software that has been operating for several years in Finland, where environmental consulting firm Benviroc’s CO2-raportti news portal presents weekly estimates of Finland's emissions by province and, increasingly, by city.
There are also more sophisticated systems that attempt to directly observe rather than estimate localized GHG emissions. Last year, for example, researchers at the Swiss Federal Laboratories for Materials Science and Technology used ground station detection data to model how much trifluoromethane (a gas whose 100-year warming impact is 15 000-times greater than that of CO2) were being released from each country in Western Europe. Their findings differed substantially from the emissions levels reported to the U.N. by several countries; Italy's reports appear to be 10 times too low, likely due to undeclared emissions from a refrigerants factory near Milan.
Such top-down reporting thus does more than simply raise consciousness about sources and causes of GHGs. It provides an independent means of verifying GHG emissions, something that could be critical to reignite diplomatic efforts to control and ultimate drive down GHGs. As ASU's Gurney puts it: “These results may also help overcome current barriers to the United States joining an international climate change treaty.”
Peter Fairley has been tracking energy technologies and their environmental implications globally for over two decades, charting engineering and policy innovations that could slash dependence on fossil fuels and the political forces fighting them. He has been a Contributing Editor with IEEE Spectrum since 2003.


