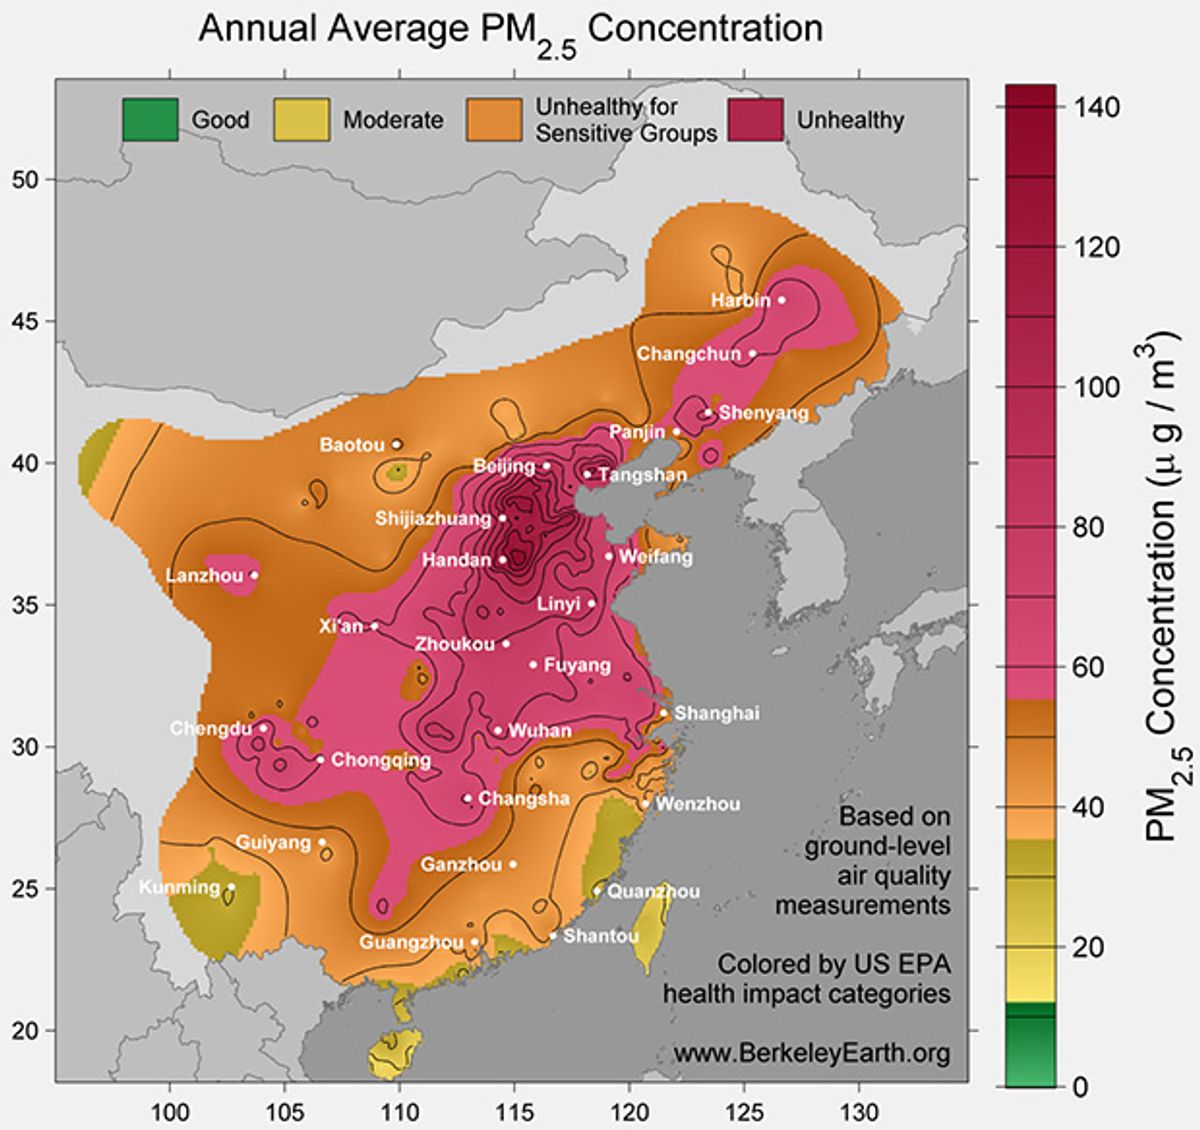
By crunching data from satellites and ground monitoring stations, environmental scientists are creating maps and forecasts that reveal the scope of China’s air pollution problem in unprecedented detail. The big question is: Will all this data have any impact on environmental policy?
The maps show that China’s air pollution is beyond bad, it’s catastrophic. In Beijing, residents are responding to the ongoing “airpocalypse” by wearing heavy-duty respirator masks as they go about their daily business, or, increasingly, by never going outside. Fancy schools now feature domes that enclose their playgrounds and sports fields, and residential towers connect directly to underground malls and subway stations.
At the time of this writing, Beijing’s air quality index is 159, which is actually a pretty good day for the megacity. True, the widely used EPA rating system calls anything above 150 “unhealthy,” likely to aggravate heart and lung conditions and to cause respiratory problems among the general population. But there have been days when Beijing’s air quality is literally off the charts, exceeding the “hazardous” rating that tops out at 500.
A number of existing websites and apps provide real-time air quality info for worried city residents wondering if they dare cycle to work or open their windows. But precise data for air quality across the country has been hard to come by, and both forecasts and historical data have been lacking. A startup and a nonprofit, both hailing from the San Francisco area, are now addressing those gaps.
Carl Wang was born in Beijing, but has lived in the United States for the last decade, working as an air pollution researcher. Now he’s heading back to China as the founder of a startup that maps smog across the country at a 1-km resolution, and provides a 7-day forecast. Wang says his company, Gago Environmental Solutions, can create custom tools for China government agencies that will enable better management strategies.
Wang’s forecasts rely on proprietary calculations that combine pollution data with meteorological data. “Relative humidity, temperature, wind speed—all these play an important role in these calculations,” Wang tells IEEE Spectrum. Specific regional weather patterns require different calculations, he says.
His system uses pollution data drawn from three satellites and 1,400 ground monitoring stations. The satellites (two from NASA, and one from the Japanese space agency) use infrared sensors to map particles suspended in the atmosphere. The ground monitoring stations, run by the Chinese government, provide hourly readings of six major air pollutants that are used to create the air quality index. Among the six is the crucial PM 2.5, a measure of particulate matter less than 2.5 micrometers in size, small enough to penetrate deep into the lungs. All together, Wang says his system is crunching 30 to 40 gigabytes of data every hour.
The data from China’s monitoring stations is freely available online, but that hasn’t always been the case. Wang notes that a few years ago, a controversy erupted in China over the U.S. embassy’s monitoring of PM 2.5 and its very public tweeting of the measurements. The Chinese government initially declared this monitoring illegal and pressured the embassy to stop, but has since reversed its position. “Then, environmental data was considered national security issue, but now it’s totally different,” Wang says.
Well, maybe it’s not totally different: In March, China’s government censors restricted access to an acclaimed documentary about China’s air pollution, Under the Dome.
Wang is heading to China next week for meetings with local and national environmental agencies. His forecasts could not only alert a local agency about an upcoming “poor air quality day,” he says, but could also indicate the contributing sources of the problem. And that would enable it to take action. For example, a forecast showing high concentrations of carbon monoxide and soot, which are indicative of car pollution, could cause an agency to tweak its traffic control policies. “With our smog mapping product, they could use this policy tool more effectively,” Wang says.
Another impressive display of data-crunching comes from the nonprofit group Berkeley Earth. This group started scraping hourly data from 1,500 air monitoring stations in China and adjoining countries in April 2014, and is now publishing maps and making its data archives available.
Elizabeth Muller, the group’s executive director, says the group is advancing knowledge in three ways. First, they use statistical methods to estimate air pollution levels for unmonitored locations, based on readings from surrounding locations. Second, they’re making historical data readily available for the first time (in convenient formats like the animation below). “The problem is, you can find out what pollution is right now, this hour, at most of the stations across China,” she tells Spectrum. “But you can’t find out what it was yesterday, or a week ago, or a year ago.”
Third, the group is meshing local pollution measurements with wind measurements to reveal the sources of pollution (i.e., what’s blowing in the wind, and from where). “We’re hopeful that these maps will help both the government and the public at large to appreciate the importance of this issue,” Muller says. “And because we’re able to identify sources, that should make it easier to do something about it.”
Muller says she thinks there’s a faction of the Chinese government that wants to openly address the problem of air pollution, but another faction that fears such a frank discussion will endanger “social harmony.” Which indeed it might. When people learn that breathing the air can kill them—Berkeley Earth estimates that air pollution contributes to 1.6 million deaths each year—they’re liable to be a little upset.
Eliza Strickland is a senior editor at IEEE Spectrum, where she covers AI, biomedical engineering, and other topics. She holds a master’s degree in journalism from Columbia University.


