Update 19 May 2020: New research described in the journal Nature Climate Change estimates that global CO2 emissions dropped by 17 percent from January to early April 2020 compared with mean 2019 levels.
The coronavirus outbreak has sent the global economy reeling as businesses shutter and billions of people hunker down. Air travel, vehicle traffic, and industrial production have swiftly declined in recent weeks, with much of the world frozen in place until the virus—which has killed more than 39,000 people globally—can be safely contained. One consequence of the crisis may be a sizable, if temporary, decline in heat-trapping emissions this year.
Global carbon dioxide emissions could fall by 0.3 percent to 1.2 percent in 2020, says Glen Peters, research director of the Center for International Climate Research in Norway. He based his estimates on new projections for slower economic growth in 2020. In Europe, CO2 emissions from large sources could plunge by more than 24 percent this year. That’s according to an early assessment of the Emissions Trading Scheme, which sets a cap on the European Union’s emissions. In Italy, France, and other nations under quarantine, power demand has dropped considerably since early March.
As experts look to the future, Lauri Myllyvirta is tracking how the new coronavirus is already affecting China—the world’s largest carbon emitter, where more than a dozen cities were on lockdown for nearly two months. Myllyvirta is an analyst at the Centre for Research on Energy and Clean Air, an independent organization. Previously based in Beijing, he now lives in Helsinki, where I recently reached him by phone. Our conversation is edited and condensed for clarity.
IEEE Spectrum: You estimated that China’s carbon emissions temporarily fell by 25 percent over a four-week period, starting 3 February. How did you determine those results?
Lauri Myllyvirta: We routinely track all kinds of high-frequency indicators on China’s energy use and industrial production. Most of the data sets are available through Wind, a financial data platform that is like China’s Bloomberg Terminal. You get a much more granular, up-to-date picture than by looking at monthly or annual statistics.
China’s greenhouse gas emissions are very biased toward the heavy-industry sectors. Coal-fired power, steel, cement, and chemicals make up the vast majority of coal consumption. The hauling around of these materials and mining them takes up most of the oil demand. So in that sense, by far the most important thing is being able to track these interchanges of industrial sectors.
China was originally going to return to work on 3 February, after the Lunar New Year [on 25 January]. So we compared reductions in coal and crude oil use to the same period following the holiday in 2019.
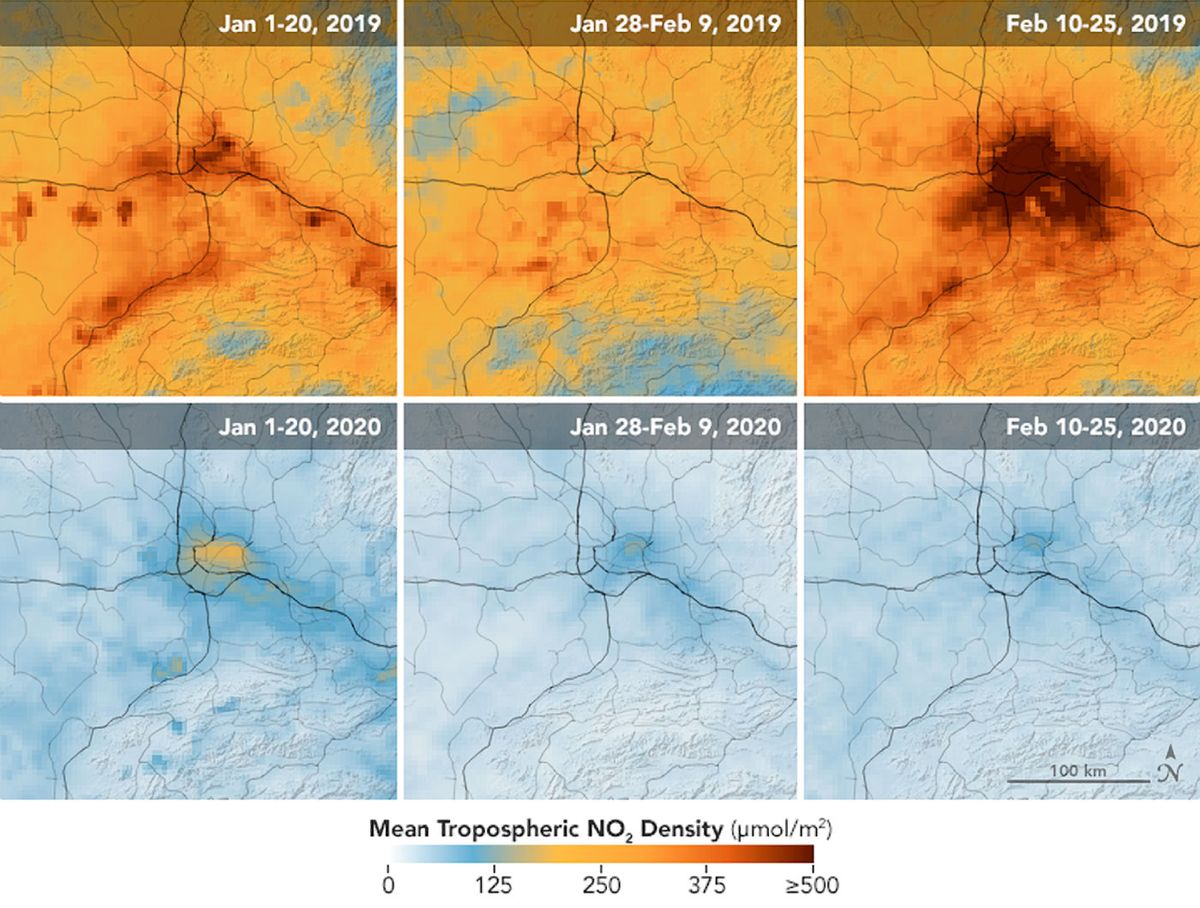
We also looked at levels of nitrogen dioxide pollution, measured from both NASA satellites and Chinese government stations.
Spectrum: How do you validate and update your analysis as new information becomes available?
Myllyvirta: There’s one sector for which we don’t have high-frequency data: cement. I made a very conservative estimate initially for cement production, and official Chinese statistics recently indicated that the impact in February was a lot more dramatic than I’d assumed. Official data showed that cement output fell by 30 percent in January-February, with a 60 percent reduction in the weeks after the Lunar New Year.
The sector where official numbers indicated a smaller reduction than I had estimated was coal-fired power. Thermal power generation was reported down 9 percent, indicating a roughly 20 percent drop after the holiday. Those two things—cement and coal power—roughly offset each other, so on aggregate, it looks like the 25-percent CO2 reduction is still as close to the mark as we can get.
Spectrum: How is the picture changing in China as the nation eases coronavirus-related restrictions?
Myllyvirta: The big picture after that four-week period is that things are inching back up to normal. For the first seven weeks, I estimated around an 18 percent reduction in emissions, amounting to 250 million tonnes of avoided CO2.
There are still a lot of sectors operating below their normal rates, but some seem to be making up for lost time. It looks like nitrogen dioxide emissions are back to the pre-crisis levels on aggregate, and electricity consumption is approaching those levels.
The other thing that’s happening is that China is starting to be affected by the economic crisis in the rest of the world. A lot of industries that were able to restart, especially the export-oriented industries, are now seeing order cancellations, and that might result in further reductions in energy use and emissions. Real estate developers aren’t itching to start a lot of new projects—sales fell 40 percent and construction starts fell 44 percent during the weeks affected by measures against the virus. Because of lost income, consumers aren’t really keen to make big-ticket purchases. That effect will take some time to play out.

Spectrum: What are some of the challenges to accurately assessing emissions trends in China?
Myllyvirta: Official statistics often seem to smooth the trends and shifts in what’s happening in China, especially in turbulent times. Most famously, their GDP [Gross Domestic Product] numbers fluctuate within an incredibly narrow range.
The pervasive political influence on statistics is fairly unique to China. You don’t have a lot of other countries where there are so many politically determined targets for all kinds of statistics, and where people’s careers are dependent on those targets being fulfilled. Every country has statistical error and uncertainty to different degrees, but that specific political interference is quite unique.
For example, when the official numbers came out and showed a smaller reduction in thermal power generation than we indicated [from Wind data], it’s very hard to say which one of those data sets are closer to the truth. In the analysis, I treat that as uncertainty, rather than making a call that one is right or wrong.
Spectrum: You’re posting your research online as the outbreak unfolds. What kind of feedback have you received from peers?
Myllyvirta: We haven’t had this work formally peer-reviewed, but we’re in a good place with methodology, in the sense that we’ve been tracking China for quite a while.
The most common single response from people who track emissions and energy are those who say that this is pointless, because emissions will just go back to normal once the crisis is over. I say this is way too profound a crisis for things to just go back to normal. There’s a possibility that the ultimate outcome for China is an enormous stimulus push that results in a surge in emissions above pre-crisis levels. On the other hand, there is a possibility that this crisis results in a much more sustained reduction.
I feel like this is a very important analysis to do, to highlight how dramatic the impacts are, and especially to highlight the wide range of outcomes—and I’m hoping that will inform some of the policy choices that are made.


