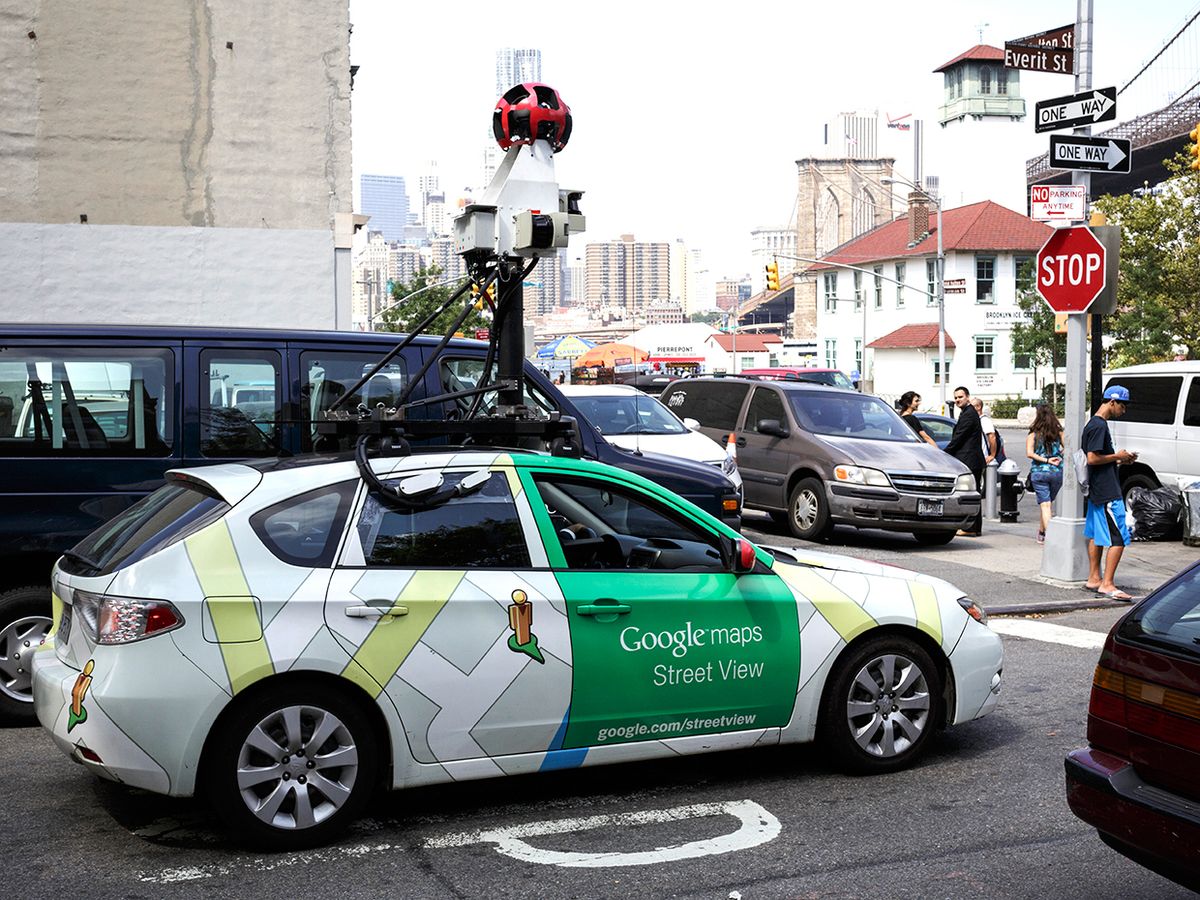
It's likely that your car says something about you. The make and model, whether it's foreign or domestic, and how expensive it is can provide information about who owns it. This doesn't work for everyone, of course, but over a large enough population, the statistics can be fairly reliable indicators. The United States spends a quarter billion dollars collecting socioeconomic information by hand through community surveys every year, but if there were a big enough database of what types of cars can be found in which neighborhoods, that data collection could be done more affordably, more frequently, and cover much larger areas. And there is a big database of neighborhood street pictures, in the form of Google Street View imagery.
Researchers from Stanford University have applied deep learning-based computer vision techniques to 50 million images across 200 regions to identify 22 million cars, which is roughly 8 percent of all automobiles in the United States. Based on the types of cars and their locations, the researchers estimated the income, race, education, and voting patterns of the people living in those areas. The results they derived from pictures are impressively accurate.
In principle, using a convolutional neural network (CNN) to identify cars in a street view image seems like a straightforward problem. However, in order to accurately estimate demographic statistics, it was necessary to know the make, model, year, and trim level for each vehicle. Many vehicles don't change a whole heck of a lot from year to year, so to train the CNN, the researchers relied on both Mechanial Turk random humans, as well as car experts that they recruited on Craigslist. Ultimately, the CNN was trained well enough to classify vehicles in street view images into one of 2,657 categories, accounting for nearly every single visually distinct car, truck, and van sold in the United States since 1990. The CNN managed to chew through all 50 million images in two weeks with an accuracy of around 90 percent—a task which would have taken a trained human over 15 years to complete.
Once all the automobile data were collected, the researchers took demographic survey results and 2008 presidential election results for some sample areas and trained a relatively simple regression model to identify positive and negative associations between vehicles, demographics, and voting preferences. What they came up with will either surprise you very much, or not at all:
Our model detects strong associations between vehicle distribution and disparate socioeconomic factors. For instance, several studies have shown that people of Asian descent are more likely to drive Asian cars, a result we observe here as well: The two brands that most strongly indicate an Asian neighborhood are Hondas and Toyotas. Cars manufactured by Chrysler, Buick, and Oldsmobile are positively associated with African American neighborhoods, which is again consistent with existing research. And vehicles like pickup trucks, Volkswagens, and Aston Martins are indicative of mostly Caucasian neighborhoods.
In some cases, the resulting associations can be easily applied in practice. For example, the vehicular feature that was most strongly associated with Democratic precincts was sedans, whereas Republican precincts were most strongly associated with extended-cab pickup trucks (a truck with rear-seat access). We found that by driving through a city while counting sedans and pickup trucks, it is possible to reliably determine whether the city voted Democratic or Republican: If there are more sedans, it probably voted Democrat (88% chance), and if there are more pickup trucks, it probably voted Republican (82% chance).
This approach also works for all kinds of other characteristics, including income and education level. We should stress that these are general trends, of course, and if you drive one of the vehicles mentioned above but are not in the correlated demographic group, you don't need to run out and buy a new car (although the statistics do kind of suggest that somehow it might make you feel more comfortable for some reason).
Anyway, the researchers say that this method provides a way to “inexpensively determine social, economic, and political patterns in neighborhoods across America.” And since it works anywhere that Google’s Street View cars have been, it works pretty much everywhere, and we can expect that the data will continue to increase in quality, quantity, and temporal frequency as cars collect more and more data about the world around them. The general methodology here isn't just restricted to automobile identification, either. Similar correlations could be drawn from things like spacing between houses, number of stories of houses, and “extent of shrubbery,” whatever that means.
The paper, “Using deep learning and Google Street View to estimate the demographic makeup of neighborhoods across the United States,”is available in full from PNAS.
Evan Ackerman is a senior editor at IEEE Spectrum. Since 2007, he has written over 6,000 articles on robotics and technology. He has a degree in Martian geology and is excellent at playing bagpipes.


