Apps that tap into smartphone sensors to monitor human health and diagnose diseases abound. Now, engineers have come up with a way to use smartphone data to reveal if bridges are ailing, allowing repairs before they fail. Using such crowdsourced data as part of maintenance could increase a new bridge’s lifespan by over 14 years at no added cost, the researchers report in the journal Communications Engineering.
The method relies on smartphone accelerometer and GPS data collected while vehicles drive over a bridge to calculate its vibrations, which can indicate changes in the structure over time. This would be cheaper, easier, and faster than installing sensors on thousands of bridges, says Thomas Matarazzo, a professor of civil and mechanical engineering at the United States Military Academy at West Point.
Of the more than 617,000 bridges in the United States, 42 percent are more than 50 years old, and around 46,000 are deemed structurally deficient. Inspectors still rely mostly on visual inspections to assess the integrity of all these bridges. But failures happen. The bridge that collapsed in Pittsburgh on a snowy January morning this year was one that this writer used every day. Such failures “demonstrate a knowledge gap in our understanding of the true condition of our bridges,” Matarazzo says. “Monitoring bridge vibrations frequently and over the long term is key to better understanding actual bridge conditions and minimizing these knowledge gaps.”
All bridges vibrate at a specific natural frequency called the modal frequency, which is tied to the bridge’s physical characteristics like material properties, geometry, and mass. “Any changes in those quantities would result in changes in these frequencies,” he says. “If there’s significant damage in the bridge, its modal frequency would change.” But only a few bridges in the United States—typically really old ones or brand new ones—have sensor networks to measure these vibrations.
“The idea is that each individual smartphone collects noisy data, but when you aggregate this and try to understand common results you can get an idea of bridge frequency.” —Professor Thomas Matarazzo, West Point
So he and his colleagues built an app that uses mathematical methods like the Fourier transform to calculate modal frequency from acceleration changes measured over time. By combining smartphone accelerometer data with GPS data, the app gives modal frequency at different locations on a bridge.
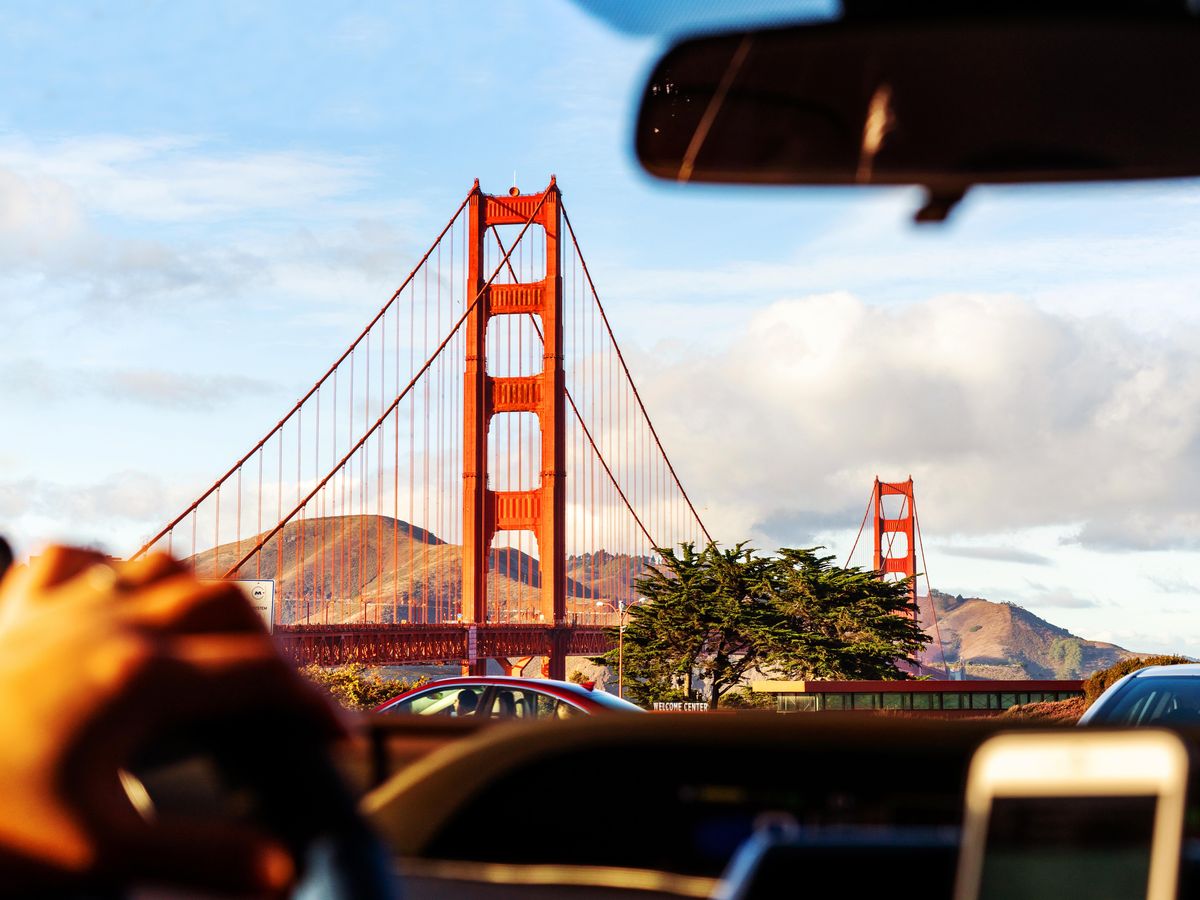
To test the app, Matarazzo and his colleagues drove across the Golden Gate Bridge 102 times. They also had Uber drivers do the same over 72 trips. They found that the data were comparable to those taken from a set of 240 traditional sensors that had been attached to the bridge for three months.
Aggregating a large amount of data is crucial because “smartphones are fundamentally pretty bad sensors,” he says. “The idea is that each individual smartphone collects noisy data, but when you aggregate this and try to understand common results you can get an idea of bridge frequency.”
The technique works best on long-span bridges such as the Golden Gate, which has a main span of 1,280 meters, because they allow collection of more data. But the team also collected data on a shorter 28-meter concrete bridge in Italy. They compared data from 280 car trips with those from six vibration sensors, and found similar results. This bridge is similar to a typical U.S. highway bridge, which make up a quarter of all U.S. bridges, says Matarazzo.
His group is now working on using smartphones to assess another bridge feature that can reveal structural integrity. Called mode shape, it is the physical shape a bridge makes at a certain frequency. “Unlike modal frequency, mode shape doesn’t change as much with weather and [is a] lot more sensitive to damage.”
The ubiquity of smartphones makes this technique especially promising, he says. “The Golden Gate bridge serves 100,000 vehicles every day. Even if 10 percent of people participated, we’d have 10,000 data sets, which is 10 times what we used in our study.”
Plus, a treasure trove of such data is already out there. Ride-sourcing companies like Uber and Lyft need to collect acceleration and GPS data to know where a vehicle is so they can track trips and match rides. “Their business model relies on smartphone data, and they have been collecting this data since their inception,” he says. “These preexisting large data sets may have a second purpose for monitoring bridges.”
Prachi Patel is a freelance journalist based in Pittsburgh. She writes about energy, biotechnology, materials science, nanotechnology, and computing.


