The Conversation (0)

Color My World: This map, the result of applying machine learning to satellite imagery, shows the mix of dominant tree species for a portion of California’s Sierra Nevada range. Red is used to indicate areas of canyon live oak ( Quercus chrysolepis), green for incense cedar ( genus Calocedrus), and blue for white fir ( Abies concolor).
Image: SilviaTerra
In 2007, one of us (Parisa) found himself standing alone in the woods of Armenia and fighting off a rising feeling of dread.
Armenia, a former Soviet-bloc country, is about the size of Maryland. Its forests provide residents with mushrooms and berries, habitat for game animals, and firewood to heat homes during the cold winters. The forests also shelter several endangered bird species.
Parisa, then a first-year graduate student studying forestry, was there to help the country figure out a plan for managing those forests. The decisions the Armenian people make about their forests must balance economic, cultural, and conservation values, and those decisions will have repercussions for years, decades, or even centuries to come. To plan properly, Armenians need to answer all sorts of questions. What level of firewood harvest is sustainable? How can those harvests be carried out while minimizing disruption to bird habitat? Can these logging operations open up spaces in a way that helps people to gather more berries?
Across the world, communities depend on expert foresters to help them manage forests in a way that best balances such competing needs. In turn, foresters depend on hard data—and have done so for a very long time.
In the early 1800s, foresters were at the forefront of a “big data” revolution of sorts. It wasn’t feasible to count every tree on every hectare, so foresters had to find another way to evaluate what the land held. The birth of scientific forestry early in the 19th century in Saxony ushered in rudimentary statistical sampling techniques that gave reliable estimates of the distribution of the sizes and species of trees across large swaths of land without someone having to measure every single tree.
A collection of this type of data is called a forest inventory, which foresters use to develop management plans and project what the forest will look like in the future. The techniques forged two centuries ago to create such inventories—laborious field sampling to arrive at population statistics—have remained largely unchanged to this day, and hundreds of foresters working in the United States still count trees with pencil and paper even now.
Parisa was excited to help communities in Armenia develop forest management plans. He had been assured that he’d have good data for the large area where he was to work, in and around Dilijan National Park. But the “forest inventory” he’d been promised turned out to be the translated field notes from Soviet foresters who had visited the area more than 30 years earlier—observations along the lines of “Went on walk on southern exposure of the mountain. Many pine, few beech.” Such casual observations couldn’t possibly provide a solid foundation on which to build a forest management plan.
Parisa needed to inventory hundreds of thousands of hectares of forest. He knew, though, that a single forester can assess roughly 20 hectares (about 50 acres) in a day. Unless he wanted to spend the next decade counting trees in Armenia, he had to find a way to get those numbers faster.
Parisa grew up in Huntsville, Ala., where his father worked for NASA. Once, when Parisa was 8 years old, he hit a baseball through a window, and his dad punished him by making him calculate the amount of force behind the ball. He got good at that sort of exercise and later came to study forestry with an unusually quantitative skill set.
In Armenia, Parisa put those skills to work figuring out how to compile a complete forest inventory using remote sensing, which has been the holy grail of forestry for decades. Within 18 months, he developed the core of the machine-learning approach that the two of us later used in founding SilviaTerra, a startup based in San Francisco that’s dedicated to producing forest inventories from remotely sensed data. Here’s an overview of the some of the challenges we faced, how we overcame them, and what we’ve been able to do with this technology.
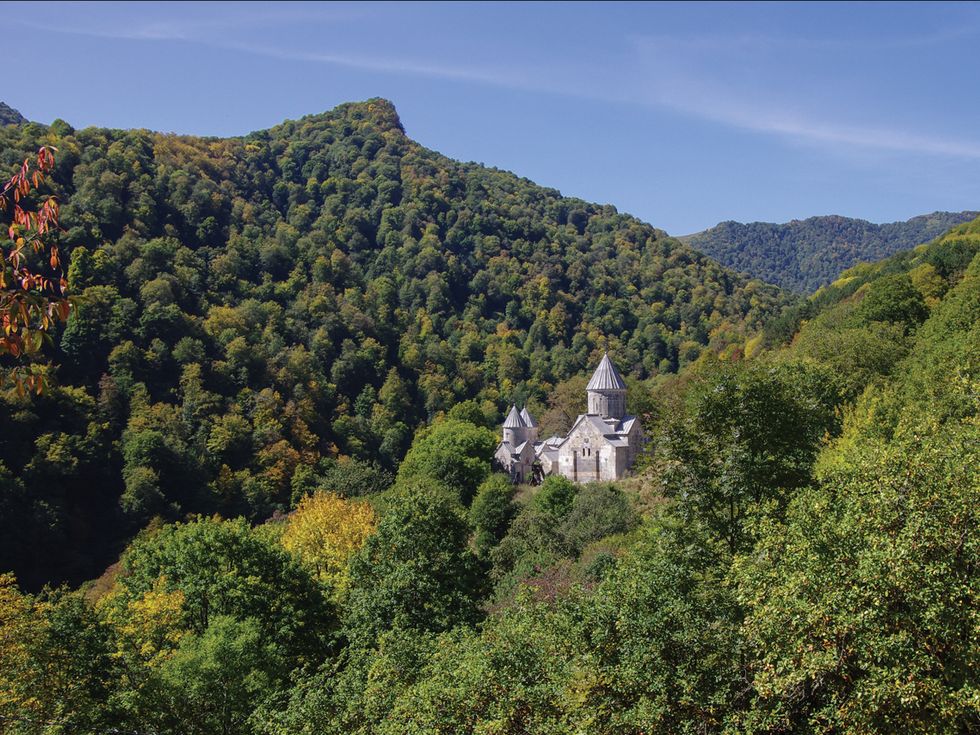
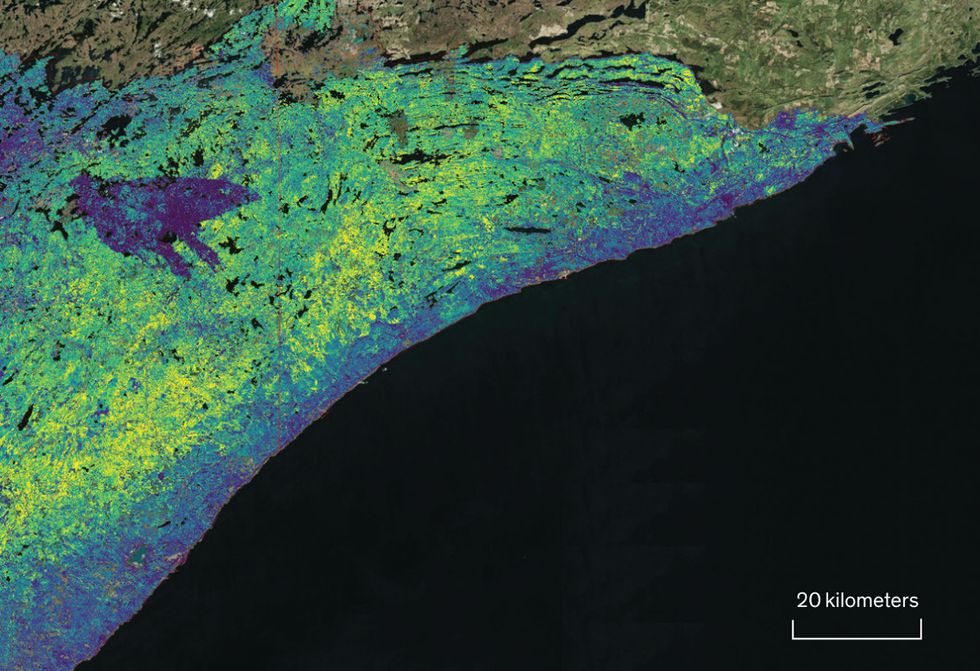
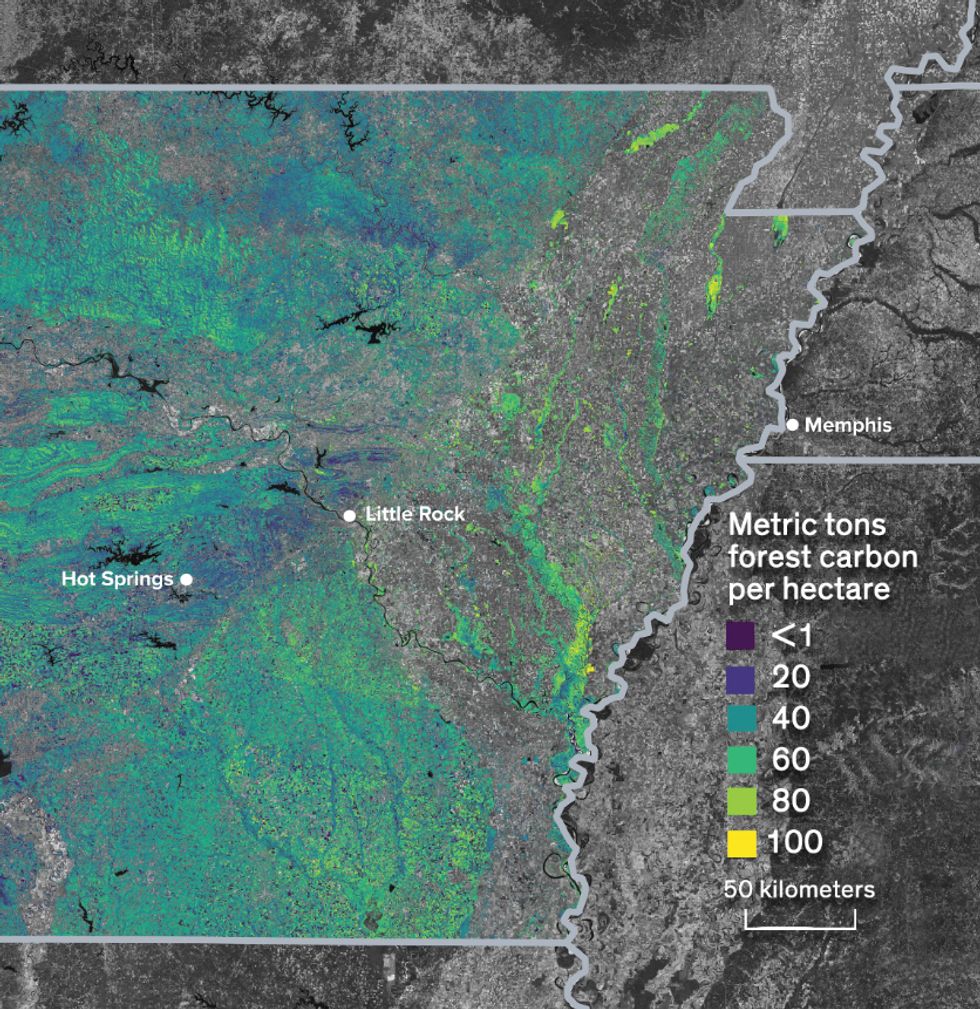 Sizing Up Trees: The research behind the authors’ work was initially focused on Dilijan National Park, in Armenia, site of the 13th-century Haghartsin Monastery (top). Their company now offers specialized maps of U.S. forests, such as this one of Superior National Forest, in Minnesota, with warmer colors showing areas of better-quality moose habitat (middle), and of Arkansas, with warmer colors showing higher amounts of carbon stored in the forest (bottom).Photos, from top: Shutterstock; SilviaTerra (2)
Most people rarely think about forests, yet they play a vital role in our lives. The lumber that was used to build your house, the paper cup that holds your morning coffee, and the cardboard box containing your latest online delivery all came from a tree growing in the woods.
Measuring the potential of forests to provide those things has historically been expensive, slow, and low tech. The biggest forestry companies in the United States spend millions each year paying people to laboriously count and measure trees. The forests owned by such companies make up a sizable fraction of the U.S. total. So it made sense for us to concentrate on such places after we launched SilviaTerra in 2010.
The next year, our fledgling startup won the Sabin Sustainable Venture Prize from the Yale Center for Business and the Environment, in New Haven, Conn. We spent some of the US $25,000 prize money driving around the southeast United States in a pickup truck, looking for companies that owned more than 10,000 acres of forest so we could set up meetings with their executives.
We soon found our first paying customers. Later, we signed contracts with companies elsewhere, eventually applying our technology to all of the major forest types in the United States.
For the most part, our service has proved very attractive—so it isn’t a hard sell. What we offer is analogous to what farmers require to practice precision agriculture, a general approach that often uses remote sensing to inform decisions about what to grow, how to fertilize it, when to harvest the crop, and so forth. You might say that SilviaTerra is enabling “precision forestry.”
Being precise about forests, however, is more difficult than being precise about farmland. For one thing, you almost always know what you’ve planted in your fields, and it’s almost invariably just one crop. But natural forests can have a bewildering mix of tree species. Often, the dominant tree species can hide other kinds of trees lower in the canopy. And while crops are generally planted in rows or other regular geometries, forests usually have a much more organic spatial arrangement (although some managed plantations do have trees growing neatly in rows). What’s more, forests tend to be, um, out in the woods, and their remoteness makes it hard to collect ground truth.
Another technical challenge for us has been dealing with a veritable tsunami of data. The Landsat satellite archive, for example, stretches back to 1972 and is enormously rich, with millions of images, for both optical and infrared bands. And the amount of nationwide high-resolution aerial imagery, digital elevation maps, and so forth just keeps growing every day. There are now terabytes of relevant data to digest.
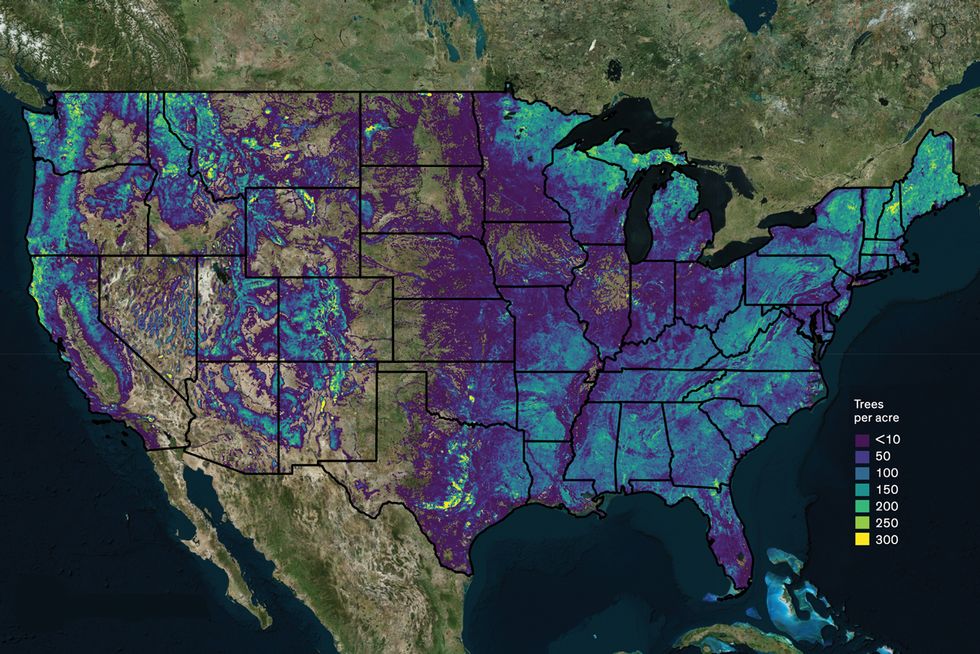
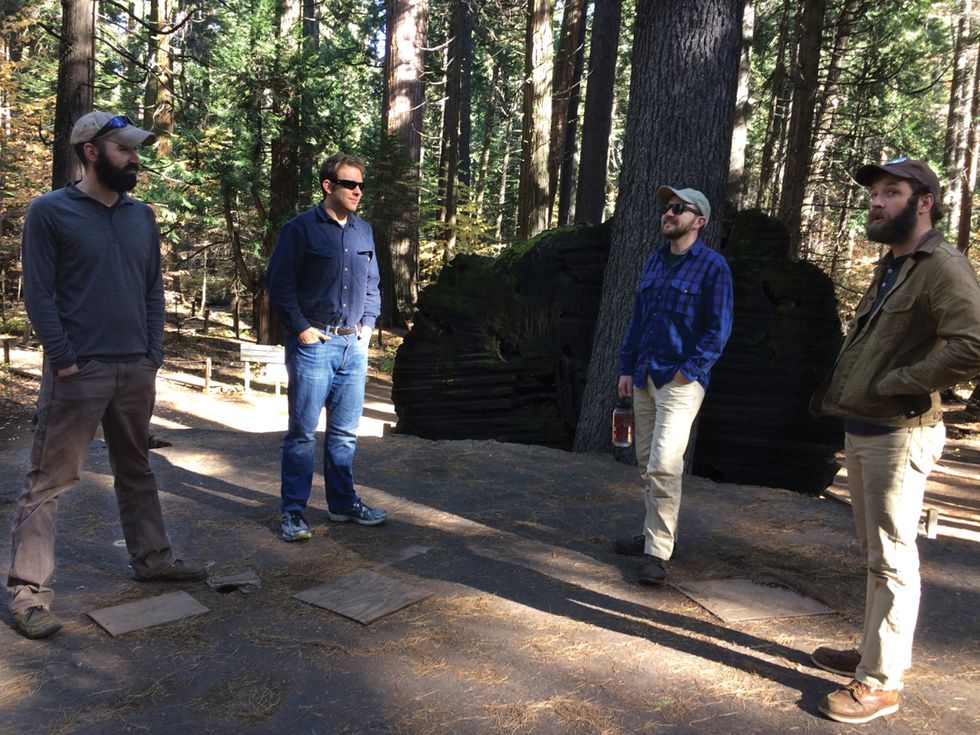 The Whole Megillah: The authors’ company, SilviaTerra, used satellite imagery for its national Basemap project, which tracks forest characteristics throughout the United States, producing such results as this map of tree density. Members of the SilviaTerra team stand on a giant stump (bottom) at Big Trees State Park in Calveras County, Calif.Photos: SilviaTerra
An even taller hurdle was finding a way to analyze the imagery in a way that gives reliable estimates. The executives of publicly owned timber companies are especially keen on having good estimates, because they have to report accurate numbers about their holdings to investors.
Another big challenge was dealing with the fact that most of the satellite imagery available to us was of quite limited resolution—typically 15 meters. That’s much too coarse to make out individual trees in an image. As a result, we had to use a statistical technique rather than computer vision per se here. (One benefit of this statistical approach is that it avoids the biases that commonly result with high-resolution tree-delineation methods.)
For all these reasons, creating an inventory of what’s growing in a forest is technically more difficult than creating an inventory of what’s growing on a farmer’s field. The economic stakes are also different: The value of the annual crop harvest in the United States is about $400 billion, while the annual timber harvest is only $10 billion.
That said, forests provide many benefits that nobody pays for, including wildlife habitat, carbon sequestration, and water filtration, not to mention nice places to camp for the weekend.
More than 20 years ago, the economist Robert Costanza and others examined the value of the various ecosystem services that forests deliver, even though no money changes hands. Based on those results, we estimate that U.S. forests provide about $100 billion worth of ecosystem services every year. Part of our mission at SilviaTerra is to help put real numbers on these ecosystem services for every acre of forest in the United States.
The output of our very complicated machine-learning system for processing remotely sensed forest imagery is actually very simple: For each 1/20 of an acre (0.02 hectare, or a little smaller than the footprint of an average U.S. home), the system builds a list of the trees standing there. The list includes the species of each tree and its diameter as measured 4.5 feet (1.4 meters) off the ground, following standard U.S. forestry practice. Other key metrics, such as tree height and total carbon storage, can be derived from these values. Things like wildfire risk or the suitability of the land as deer habitat can be modeled based on the types of trees present.
To create this giant list of trees, we combined thousands of field measurements with terabytes of satellite imagery. So we needed field data for the entire United States. Fortunately, for decades U.S. taxpayers have paid the U.S. Forest Service to establish a nationwide grid of forest measurements. This amazing collection of observations spans the continental United States, and it provided exactly what we needed to train our machine-learning system to gauge the number, size, and species of trees present in remote-sensing imagery.
In most remote-sensing forestry efforts, a human analyst starts with a single image that he or she hopes will document everything in the area of interest. For example, the analyst might use lidar data in the form of a high-resolution point cloud (the coordinates of a set of points in 3D space) to figure out the number of trees present, as well as their heights and species.
Lidar imagery is expensive to obtain, though, so there’s not much of it around. And what can be had is often sorely out of date or incomplete. For these reasons, we instead relied on a wide range of free satellite and aerial imagery. We used all kinds—visible light, near-infrared, radar—because each kind of image tells you about a different aspect of the forest. Landsat imagery stretching back decades is often great for picking up on the differences among species, while radar typically contains much more information about overall forest structure. The key is to combine these different types of imagery and analyze them in a statistically rigorous way.
Before we took on this problem, a single high-resolution inventory of all U.S. forests did not exist. But if society is going to prevent more wildfires, grow rural economies in a sustainable way, and manage climate change, a much better understanding of our forests is needed. We boosted that understanding in a unique way when we finished our nationwide forest Basemap project last year.
Although we had previously applied our methodology to many focused projects, compiling a forest inventory for the continental United States was an entirely new scale of undertaking. We were very fortunate to partner with Microsoft, which in 2017 launched its AI for Earth grant program to provide the company’s tools to outside teams working on conservation projects. We applied for and ultimately received a grant to expand the forest inventory work we had been doing.
Using Microsoft Azure, the company’s cloud-computing platform, we were able to process over 10 TB of satellite imagery. It wasn’t just a matter of needing more computing power. Modeling the particular kinds of forests present in different regions was a major challenge. So was recognizing issues with data integrity. We spent one confused weekend, for example, trying to sort out problems in the output before we realized that some high-resolution aerial imagery is blacked out over military bases!
While we weren’t expecting such artificial holes in the data, we knew from our prior work that it can be hard to find cloud-free images of a given area. For some regions—especially in the Pacific Northwest—you simply can’t find any such images that cover an appreciable area.
Luckily, Lin Yan, now of Michigan State University, published a method for dealing with just this problem in 2018. When an image is obscured by a cloud, his algorithm replaces the cloud, pixel by pixel, with pixels from another image obtained when the sky over that spot of land was clear. We applied Yan’s algorithm to produce a set of cloud-free images, which were much easier to analyze.
We unveiled our nationwide forest inventory last year, but we knew it was just a starting point: Having better information doesn’t do any good unless it actually affects the decisions that people are making about their land. So influencing those decisions is now our focus.
For that, we’ve again partnered with Microsoft, which intends to become carbon negative by 2030. Microsoft can’t cease emitting carbon dioxide entirely, but it plans to offset its emissions, at least in part by paying forest owners to defer their timber harvests and thus sequester carbon through the growth of trees.
Carbon markets are not new, but they’ve been notoriously ineffective because it’s very hard to monitor such carbon sequestration. Our Basemap, which is updated annually, now makes that monitoring straightforward.
New possibilities also open up. The California carbon market, for example, is accessible only to landowners with more than 2,000 hectares of trees—smaller forests are too expensive to monitor. It also requires forest owners to make a 100-year commitment to keep carbon stocks at a certain level. Yet the most important time to sequester carbon is now, not a century in the future. A shorter-term contract of one year would provide the same immediate benefit at a lower cost, allowing much larger areas to be protected, at least in the short term.
Our Basemap dramatically lowers the cost of monitoring forests over time, which will allow millions of small landowners to participate in such markets. And because the Basemap is updated every year, Microsoft and others can make payments to those landowners year after year, providing much greater value for the money spent combating climate change.
Markets work well for commodities like corn, because when you sign a futures contract to sell corn at a certain price, someone down the line has to deliver a quantity of corn to a warehouse. There, the corn will be weighed and examined, so it’s easy enough to measure what’s being bought.
Using markets to influence carbon sequestration or land conservation is much harder, in large part because these processes usually take place out of sight, somewhere out in the woods. It’s difficult enough to put a dollar value on what has been gained by not cutting trees down, but if you can’t even determine whether trees have been harvested from a given area, you’ll be very reluctant to pay a landowner for the promise not to cash in on his or her timber reserves.
SilviaTerra’s Basemap now gives people in the United States a way to measure and pay for trees that are allowed to remain standing so that these forests will continue to provide important ecosystem services. Being able to see the forest and the trees in this way, we believe, will help shape a more sustainable future.
About the Author
Zack Parisa and Max Nova are cofounders of the San Francisco–based precision-forestry startup SilviaTerra.
{"imageShortcodeIds":[]}


