The Conversation (0)

Photo: GHGSAT
Purple
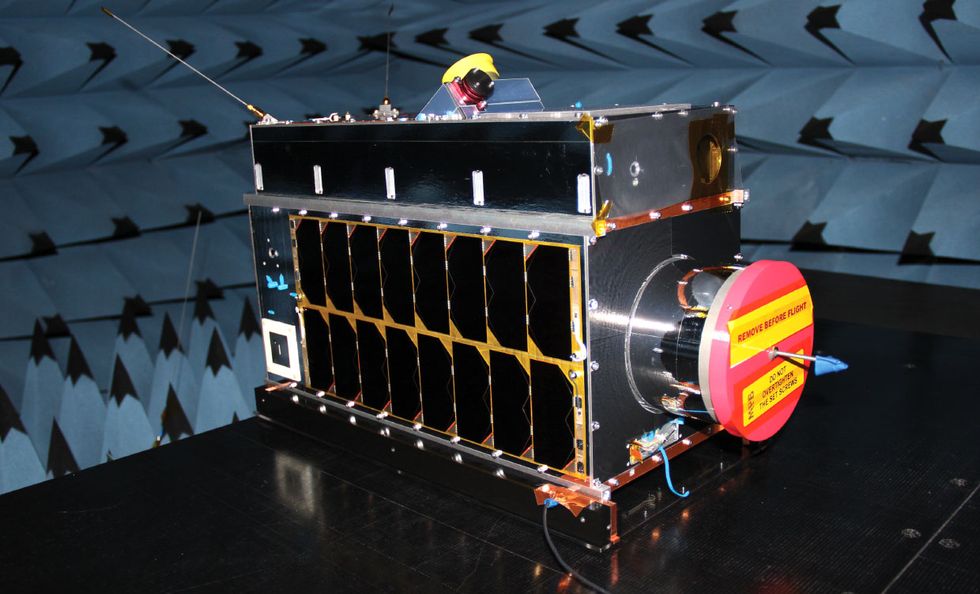 Now in Orbit: Our newest satellite, Iris, launched in September and underwent electromagnetic testing earlier this year.Photo: GHGSat
Something new happened in space in January 2019. For the first time, a previously unknown leak of natural gas was spotted from orbit by a microsatellite, and then, because of that detection, plugged.
The microsatellite, Claire, had been flying since 2016. That day, Claire was monitoring the output of a mud volcano in Central Asia when it spied a plume of methane where none should be. Our team at GHGSat, in Montreal, instructed the spacecraft to pan over and zero in on the origin of the plume, which turned out to be a facility in an oil and gas field in Turkmenistan.
The need to track down methane leaks has never been more important. In the slow-motion calamity that is climate change, methane emissions get less public attention than the carbon dioxide coming from smokestacks and tailpipes. But methane—which mostly comes from fossil-fuel production but also from livestock farming and other sources—has an outsize impact. Molecule for molecule, methane traps 84 times as much heat in the atmosphere as carbon dioxide does, and it accounts for about a quarter of the rise in atmospheric temperatures. Worse, research from earlier this year shows that we might be enormously underestimating the amount released—by as much as 25 to 40 percent.
Satellites have been able to see greenhouse gases like methane and carbon dioxide from space for nearly 20 years, but it took a confluence of need and technological innovation to make such observations practical and accurate enough to do them for profit. Through some clever engineering and a more focused goal, our company has managed to build a 15-kilogram microsatellite and perform feats of detection that previously weren’t possible, even with a US $100 million, 1,000-kg spacecraft. Those scientific behemoths do their job admirably, but they view things on a kilometer scale. Claire can resolve methane emissions down to tens of meters. So a polluter (or anybody else) can determine not just what gas field is involved but which well in that field.
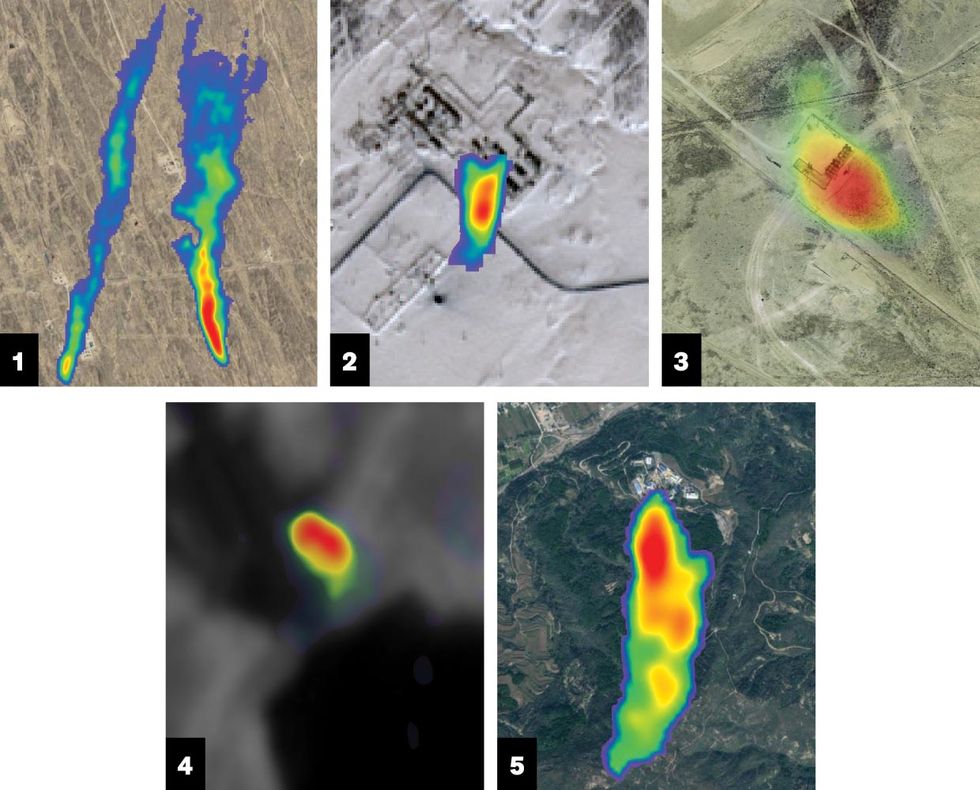 Eye in the Sky: The microsatellite Claire has spotted a number of methane plumes over the last four years, including at the following locations: 1) the Balkan Region of western Turkmenistan; 2) a gas facility in Yamalo-Nenets Autonomous Okrug, in northwestern Siberia; 3) the Permian Basin, in western Texas; 4) the Lom Pangar Dam, in eastern Cameroon; and 5) a coal mine in Shanxi, China.Images: GHGSat
Since launching Claire, our first microsatellite, we’ve improved on both the core technology—a miniaturized version of an instrument known as a wide-angle Fabry-Pérot imaging spectrometer—and the spacecraft itself. Our second methane-seeking satellite, dubbed Iris, launched this past September, and a third is scheduled to go up before the end of the year. When we’re done, there will be nowhere on Earth for methane leaks to hide.
The creation of Claire and its siblings was driven by a business case and a technology challenge. The business part was born in mid-2011, when Quebec (GHGSat’s home province) and California each announced that they would implement a market-based “cap and trade” system. The systems would attribute a value to each ton of carbon emitted by industrial sites. Major emitters would be allotted a certain number of tons of carbon—or its equivalent in methane and other greenhouse gases—that they could release into the atmosphere each year. Those that needed to emit more could then purchase emissions credits from those that needed less. Over time, governments could shrink the total allotment to begin to reduce the drivers of climate change.
Even in 2011, there was a wider, multibillion-dollar market for carbon emissions, which was growing steadily as more jurisdictions imposed taxes or implemented carbon-trading mechanisms. By 2019, these carbon markets covered 22 percent of global emissions and earned governments $45 billion, according to the World Bank’s State and Trends of Carbon Pricing 2020.
Despite those billions, it’s methane, not carbon dioxide, that has become the focus of our systems. One reason is technological—our original instrument was better tuned for methane. But the business reason is the simpler one: Methane has value whether there’s a greenhouse-gas trading system or not.
Markets for greenhouse gases motivate the operators of industrial sites to better measure their emissions so they can control and ultimately reduce them. Existing, mostly ground-based methods using systems like flux chambers, eddy covariance towers, and optical gas imaging were fairly expensive, of limited accuracy, and varied as to their geographic availability. Our company’s bet was that industrial operators would flock to a single, less expensive, more precise solution that could spot greenhouse-gas emissions from individual industrial facilities anywhere in the world.
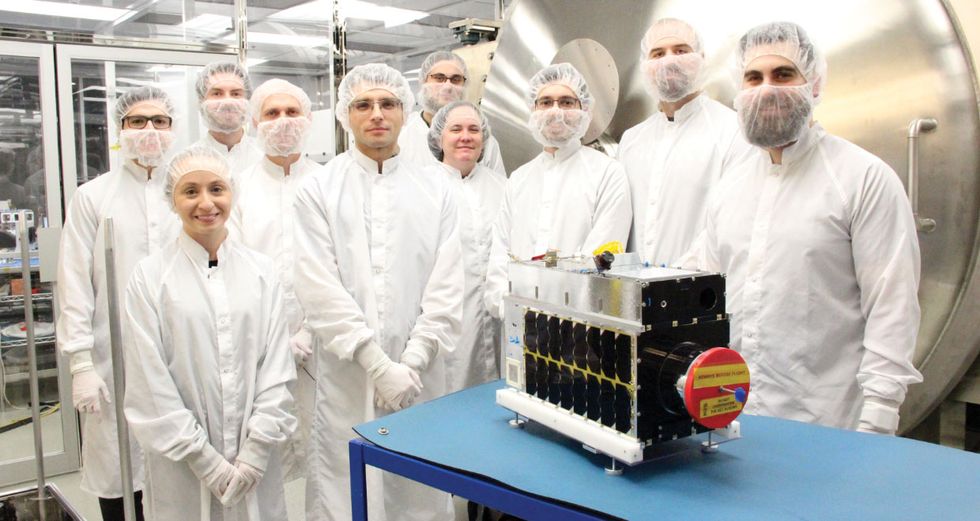 Very Proud Parents: The team at the Space Flight Laboratory, in Toronto, with a brand new 15-kilogram methane-sensing microsatellite.Photo: GHGSat
Once we’d decided on our business plan, the only question was: Could we do it?
One part of the question had already been answered, to a degree, by pioneering space missions such as Europe’s Envisat (which operated from 2002 to 2012) and Japan’s GOSat (launched in 2009). These satellites measure surface-level trace gases using spectrometers that collect sunlight scattering off the earth. The spectrometers break down the incoming light by wavelength. Molecules in the light’s path will absorb a certain pattern of wavelengths, leaving dark bands in the spectrum. The greater the concentration of those molecules, the darker the bands. This method can measure methane concentrations from orbit with a precision that’s better than 1 percent of background levels.
While those satellites proved the concept of methane tracking, their technology was far from what we needed. For one thing, the instruments are huge. The spectrometer portion of Envisat, called SCIAMACHY (SCanning Imaging Absorption spectroMeter for Atmospheric CHartographY), contained nearly 200 kg of complex optics; the entire spacecraft carried eight other scientific instruments and weighed 8.2 metric tons. GOSat, which is dedicated to greenhouse-gas sensing, weighs 1.75 metric tons.
Furthermore, these systems were designed to measure gas concentrations across the whole planet, quickly and repeatedly, in order to inform global climate modeling. Their instruments scan huge swaths of land and then average greenhouse-gas levels over tens or hundreds of square kilometers. And that is far too coarse to pinpoint an industrial site responsible for rogue emissions.
To achieve our goals, we needed to design something that was the first of its kind—an orbiting hyperspectral imager with spatial resolution in the tens of meters. And to make it affordable enough to launch, we had to fit it in a 20-by-20-by-20-centimeter package.
The most critical enabling technology to meet those constraints was our spectrometer—the wide-angle Fabry-Pérot etalon (WAF-P). (An etalon is an interferometer made from two partially reflective plates.) To help you understand what that is, we’ve first got to explain a more common type of spectrometer and how it works in a hyperspectral imaging system.
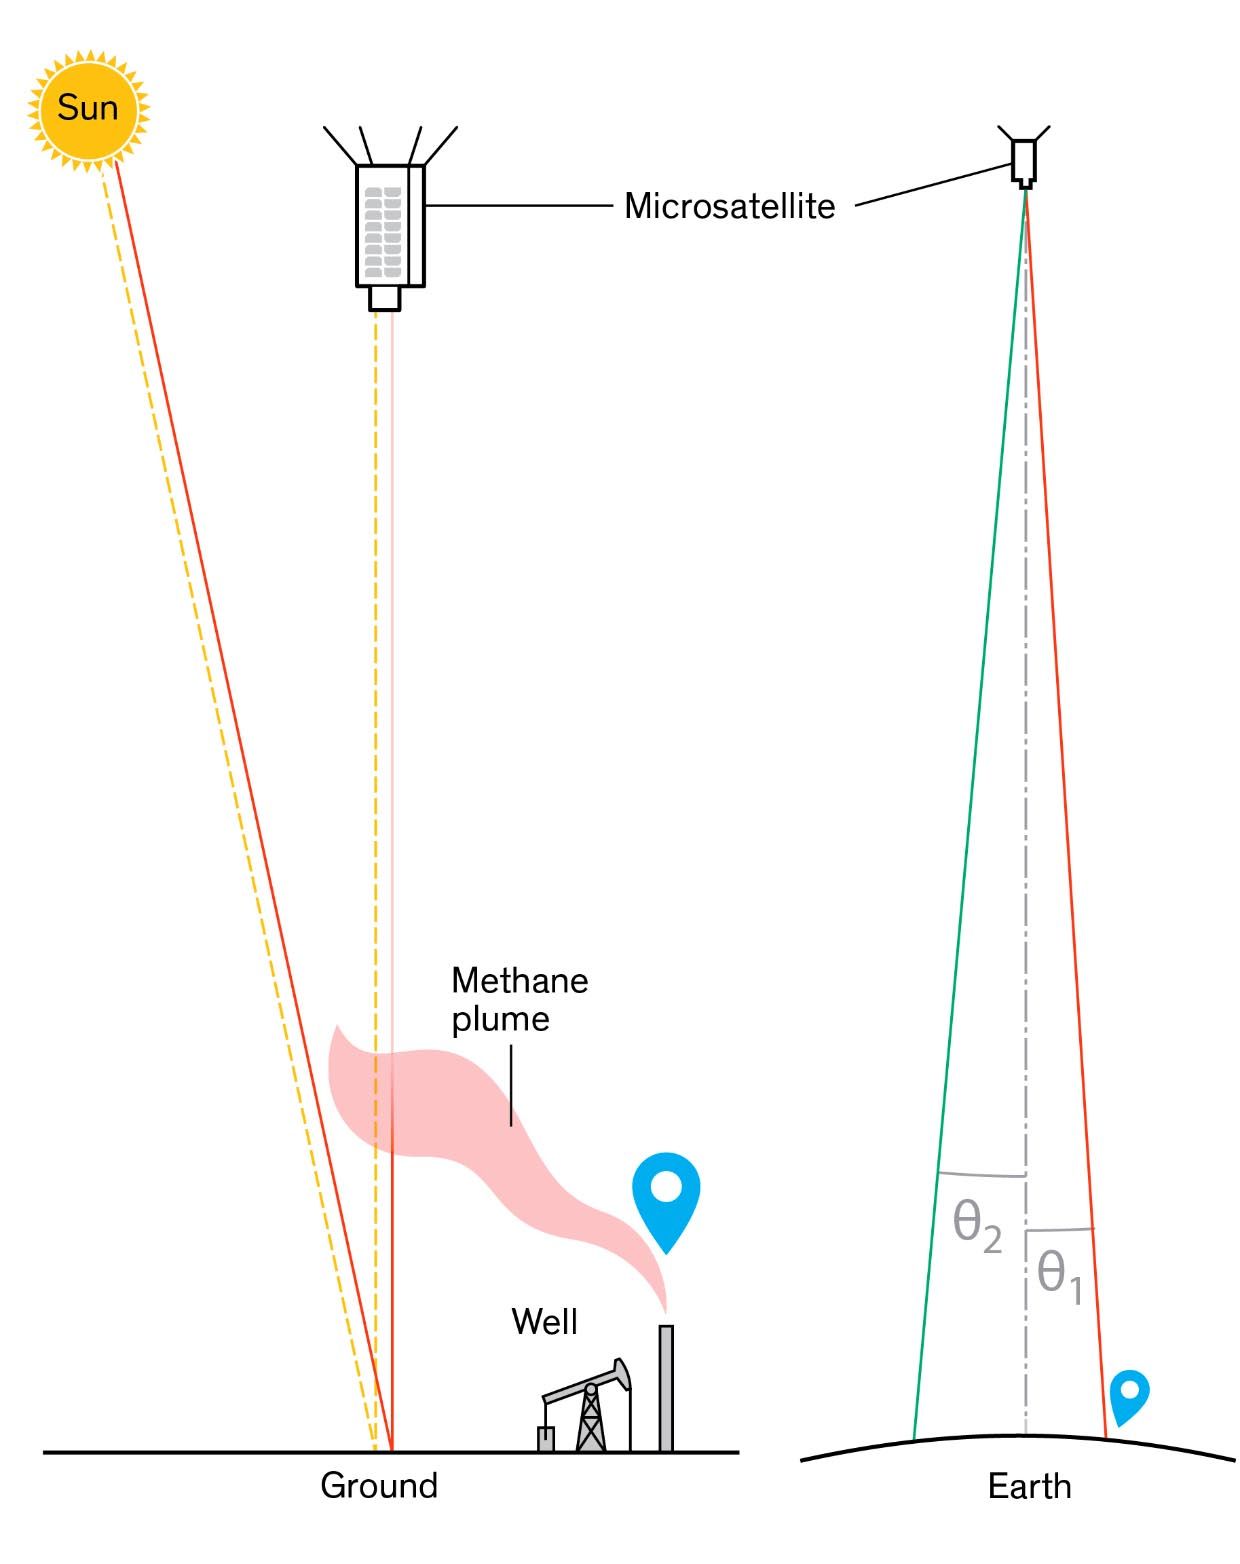
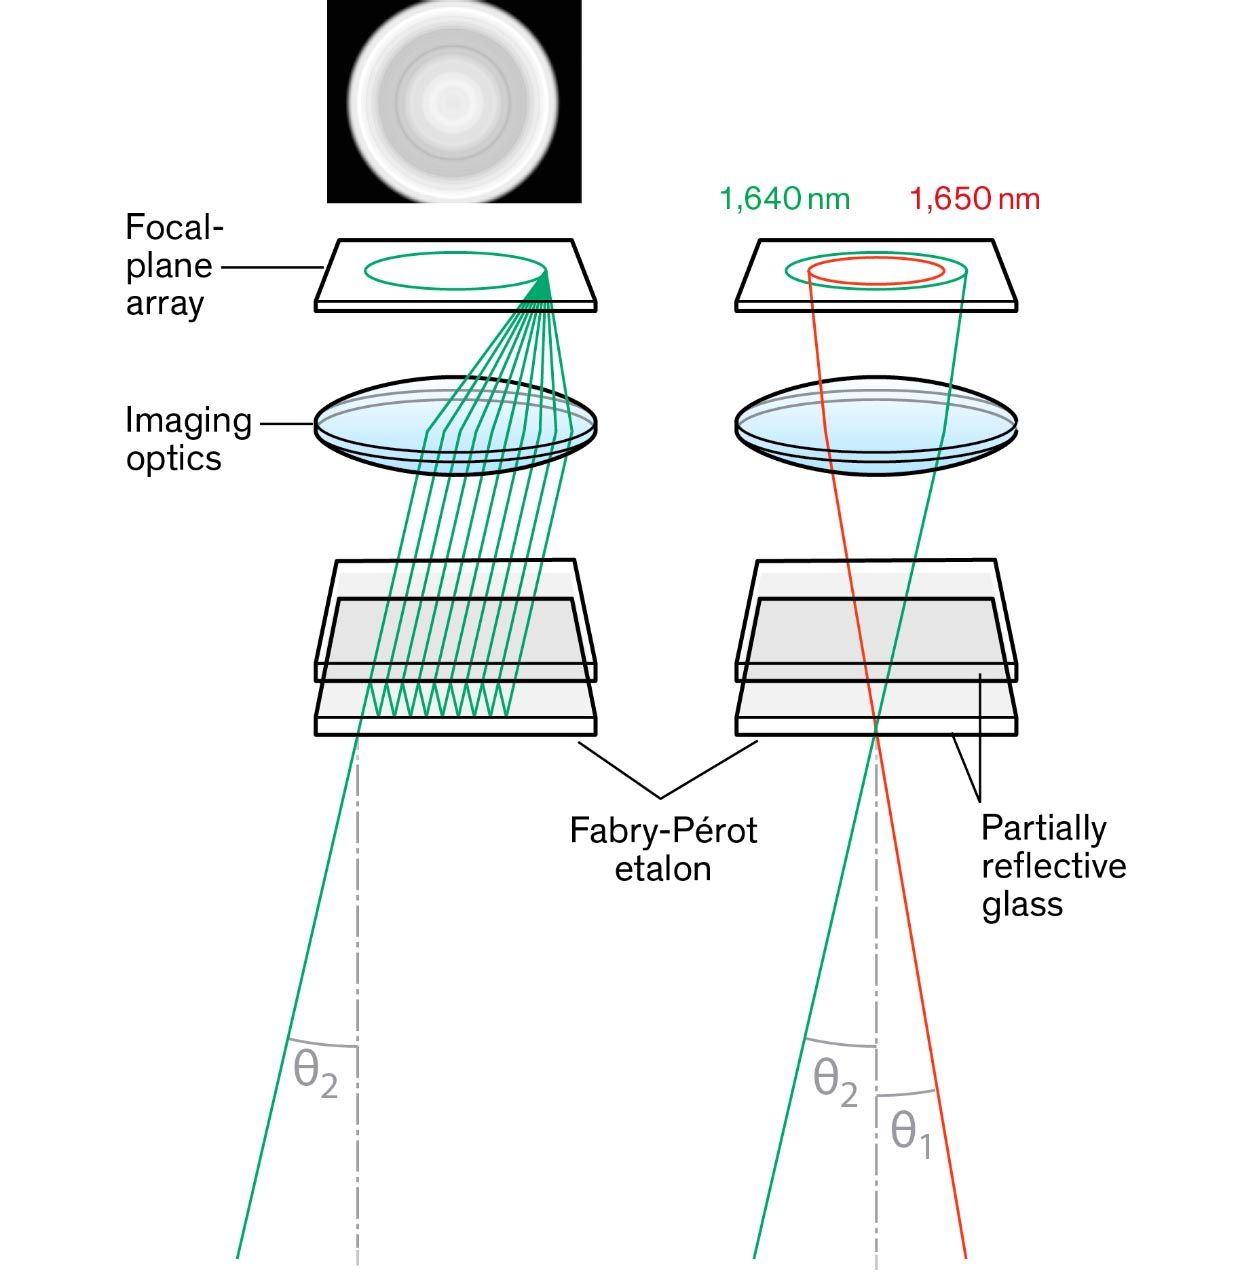
Sensing Methane From Space
The satellite measures the way a plume of gas [pink] absorbs portions of the spectrum of reflected sunlight. The key instrument involved is called a wide-angle Fabry-Pérot etalon. Right: Two infrared rays of different wavelengths streaking up to the satellite [top] from different points on the ground enter the satellite at different angles.

- The etalon is made up of two partially mirrored surfaces [bottom] held micrometers apart. A portion of the light passes through both surfaces; the rest reflects within the mirrored cavity before it passes through. If the light is of the right wavelength and enters at a particular angle, it will constructively interfere with itself [left]. The result is an angle-dependent wavelength filter [right].

Illustration: James Provost
Hyperspectral imaging detects a wide range of wavelengths, some of which, of course, are beyond the visible. To achieve such detection, you need both a spectrometer and an imager.
The spectrometers in SCIAMACHY are based on diffraction gratings. A diffraction grating disperses the incoming light as a function of its wavelength—just as a prism spreads out the spectrum of white light into a rainbow. In space-based hyperspectral imaging systems, one dimension of the imager is used for spectral dispersion, and the other is used for spatial imaging. By imaging a narrow slit of a scene at the correct orientation, you get a spectrum at each point along that thin strip of land. As the spacecraft travels, sequential strips can be imaged to form a two-dimensional array of points, each of which has a full spectrum associated with it.
If the incoming light has passed through a gas—say, Earth’s atmosphere—in a region tainted with methane, certain bands in the infrared part of that spectrum should be dimmer than otherwise in a pattern characteristic of that chemical.
Such a spectral-imaging system works well, but making it compact is challenging for several reasons. One challenge is the need to minimize optical aberrations to achieve a sharp image of ground features and emission plumes. However, in remote sensing, the signal strength (and hence signal-to-noise ratio) is driven by the aperture size, and the larger this is, the more difficult it is to minimize aberrations. Adding a dispersive grating to the system leads to additional complexity in the optical system.
A Fabry-Pérot etalon can be much more compact without the need for a complex imaging system, despite certain surmountable drawbacks. It is essentially two partially mirrored pieces of glass held very close together to form a reflective cavity. Imagine a beam of light of a certain wavelength entering the cavity at a slight angle through one of the mirrors. A fraction of that beam would zip across the cavity, squeak straight through the other mirror, and continue on to a lens that focuses it onto a pixel on an imager placed a short distance away. The rest of that beam of light would bounce back to the front mirror and then across to the back mirror. Again, a small fraction would pass through, the rest would continue to bounce between the mirrors, and the process would repeat. All that bouncing around adds distance to the light’s paths toward the pixel. If the light’s angle and its wavelength obey a particular relationship to the distance between the mirrors, all that light will constructively interfere with itself. Where that relation holds, a set of bright concentric rings forms. Different wavelengths and different angles would produce a different set of rings.
In an imaging system with a Fabry-Pérot etalon like the ones in our satellites, the radius of the ring on the imager is roughly proportional to the ray angle. What this means for our system is that the etalon acts as an angle-dependent filter. So rather than dispersing the light by wavelength, we filter the light to specific wavelengths, depending on the light’s radial position within the scene. Since we’re looking at light transmitted through the atmosphere, we end up with dark rings at specific radii corresponding to molecular absorption lines.
The etalon can be miniaturized more easily than a diffraction-grating spectrometer, because the spectral discrimination arises from interference that happens within a very small gap of tens to hundreds of micrometers; no large path lengths or beam separation is required. Furthermore, since the etalon consists of substrates that are parallel to one another, it doesn’t add significantly to aberrations, so you can use relatively straightforward optical-design techniques to obtain sufficient spatial resolution.
However, there are complications associated with the WAF-P imaging spectrometer. For example, the imager behind the etalon picks up both the image of the scene (where the gas well is) and the interference pattern (the methane spectrum). That is, the spectral rings are embedded in—and corrupted by—the actual image of the patch of Earth the satellite is pointing at. So, from a single camera frame, you can’t distinguish variability in how much light reflects off the surface from changes in the amount of greenhouse gases in the atmosphere. Separating spatial and spectral information, so that we can pinpoint the origin of a methane plume, took some innovation.
The computational process used to extract gas concentrations from spectral measurements is called a retrieval. The first step in getting this to work for the WAF-P was characterizing the instrument properly before launch. That produces a detailed model that can help predict precisely the spectral response of the system for each pixel.
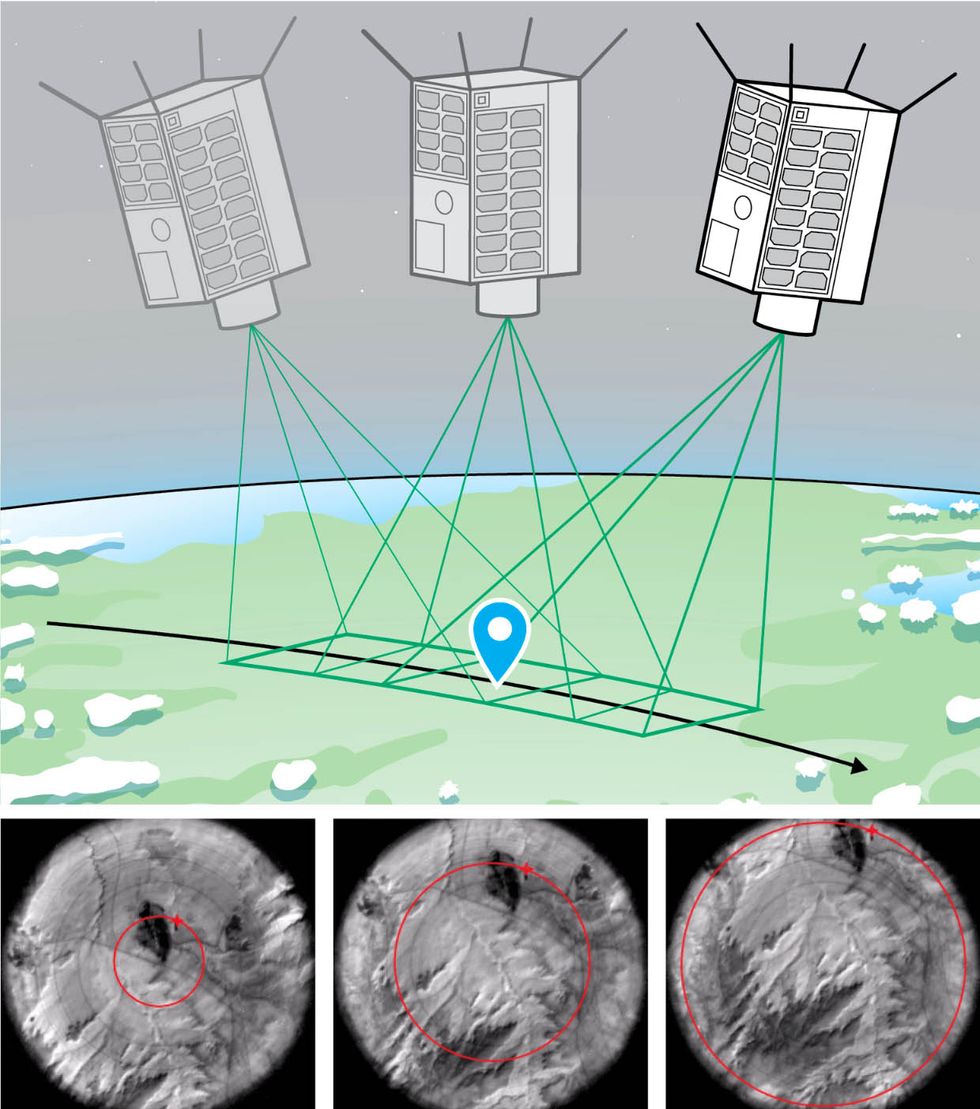 Putting It Together: To determine the complete spectrum of an entire scene, the satellite must take up to 200 images as it passes overhead (top). That way each feature will be measured at all the relevant wavelengths (red rings, bottom). The process, called a retrieval, reproduces an image of a methane plume.Illustration: James Provost. Photos: GHGSat
But that’s just the beginning. Separating the etalon’s mixing of spectral and spatial information took some algorithmic magic. We overcame this issue by designing a protocol that captures a sequence of 200 overlapping images as the satellite flies over a site. At our satellite’s orbit, that means maximizing the time we have to acquire images by continuously adjusting the satellite’s orientation. In other words, we have the satellite stare at the site as it passes by, like a rubbernecking driver on a highway passing a car wreck.
The next step in the retrieval procedure is to align the images, basically tracking all the ground locations within the scene through the sequence of images. This gives us a collection of up to 200 readings where a feature, say, a leaking gas well, passes across the complete interference pattern. This effectively is measuring the same spot on Earth at decreasing infrared wavelengths as that spot moves outward from the center of the image. If the methane concentration is anomalously high, this leads to small but predictable changes in signal level at specific positions on the image. Our retrievals software then compares these changes to its internal model of the system’s spectral response to extract methane levels in parts per million.
At this point, the WAF-P’s drawbacks become an advantage. Some other satellites use separate instruments to visualize the ground and sense the methane or CO2 spectra. They then have to realign those two. Our system acquires both at once, so the gas plume automatically aligns with its point of origin down to the level of tens of meters. Then there’s the advantage of high spatial resolution. Other systems, such as Tropomi (TROPOspheric Monitoring Instrument, launched in 2017), must average methane density across a 7-kilometer-wide pixel. The peak concentration of a plume that Claire could spot would be so severely diluted by Tropomi’s resolution that it would seem only 1/200th as strong. So high-spatial-resolution systems like Claire can detect weaker emitters, not just pinpoint their location.
Just handing a customer an image of their methane plume on a particular day is useful, but it’s not a complete picture. For weaker emitters, measurement noise can make it difficult to detect methane point sources from a single observation. But temporal averaging of multiple observations using our analytics tools reduces the noise: Even with a single satellite we can make 25 or more observations of a site per year, cloud cover permitting.
Using that average, we then produce an estimation of the methane emission rate. The process takes snapshots of methane density measurements of the plume column and calculates how much methane must be leaking per hour to generate that kind of plume. Retrieving the emission rate requires knowledge of local wind conditions, because the excess methane density depends not only on the emission rate but also on how quickly the wind transports the emitted gas out of the area.
We’ve learned a lot in the four years since Claire started its observations. And we’ve managed to put some of those lessons into practice in our next generation of microsatellites, of which Iris is the first. The biggest lesson is to focus on methane and leave carbon dioxide for later.
If methane is all we want to measure, we can adjust the design of the etalon so that it better measures methane’s corner of the infrared spectrum, instead of being broad enough to catch CO2’s as well. This, coupled with better optics that keep out extraneous light, should result in a 10-fold increase in methane sensitivity. So Iris and the satellites to follow will be able to spot smaller leaks than Claire can.
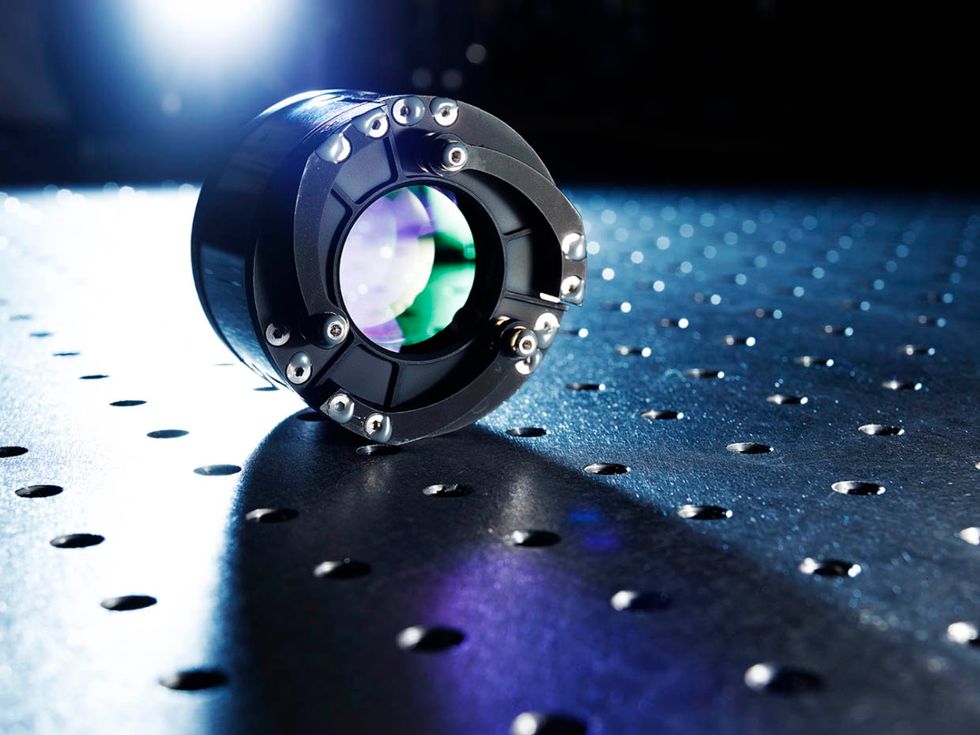 Light Fantastic: The heart of the wide-angle Fabry-Pérot imaging spectrometer.Photo: GHGSat
We also discovered that our next satellites would need better radiation shielding. Radiation in orbit is a particular problem for the satellite’s imaging chip. Before launching Claire, we’d done careful calculations of how much shielding it needed, which were then balanced with the increased cost of the shielding’s weight. Nevertheless, Claire’s imager has been losing pixels more quickly than expected. (Our software partially compensates for the loss.) So Iris and the rest of the next generation sport heavier radiation shields.
Another improvement involves data downloads. Claire has made about 6,000 observations in its first four years. The data is sent to Earth by radio as the satellite streaks past a single ground station in northern Canada. We don’t want future satellites to run into limits in the number of observations they make just because they don’t have enough time to download the data before their next appointment with a methane leak. So Iris is packed with more memory than Claire has, and the new microsatellite carries an experimental laser downlink in addition to its regular radio antenna. If all goes to plan, the laser should boost download speeds 1,000-fold, to 1 gigabit per second.
In its polar orbit, 500 kilometers above Earth, Claire passes over every part of the planet once every two weeks. With Iris, the frequency of coverage effectively doubles. And the addition in December of Hugo and three more microsatellites due to launch in 2021 will give us the ability to check in on any site on the planet almost daily—depending on cloud cover, of course.
With our microsatellites’ resolution and frequency, we should be able to spot the bigger methane leaks, which make up about 70 percent of emissions. Closing off the other 30 percent will require a closer look. For example, with densely grouped facilities in a shale gas region, it may not be possible to attribute a leak to a specific facility from space. And a sizable leak detectable by satellite might be an indicator of several smaller leaks. So we have developed an aircraft-mounted version of the WAF-P instrument that can scan a site with 1-meter resolution. The first such instrument took its test flights in late 2019 and is now in commercial use monitoring a shale oil and gas site in British Columbia. Within the next year we expect to deploy a second airplane-mounted instrument and expand that service to the rest of North America.
By providing our customers with fine-grained methane surveys, we’re allowing them to take the needed corrective action. Ultimately, these leaks are repaired by crews on the ground, but our approach aims to greatly reduce the need for in-person visits to facilities. And every source of fugitive emissions that is spotted and stopped represents a meaningful step toward mitigating climate change.
This article appears in the November 2020 print issue as “Microsatellites Spot Mystery Methane Leaks.”
About the Author
Jason McKeever, Dylan Jervis, and Mathias Strupler are with GHGSat, a remote-sensing company in Montreal. McKeever is the company’s science and systems lead, Jervis is a systems specialist, and Strupler is an optical systems specialist.