
“Everything is connected to everything else,” says the First Law of Ecology, laid down in 1971 by the U.S. biologist and activist Barry Commoner. He was addressing scientists who had been trained to manipulate a few key variables, after isolating them from all outside influences, to see their effects on a few outcomes. But in ecology, everything varies together; an interwoven web links microbes to mountains.
Even a single forest has enough entwined connections to boggle the mind. Tree growth depends on fleeting changes in the atmosphere, soil, and water. The arrival of new plant and animal species, or the disappearance of old ones, might spell disaster now or a bloom some years hence. Even the tiniest microorganisms can shape the fate of towering oaks.
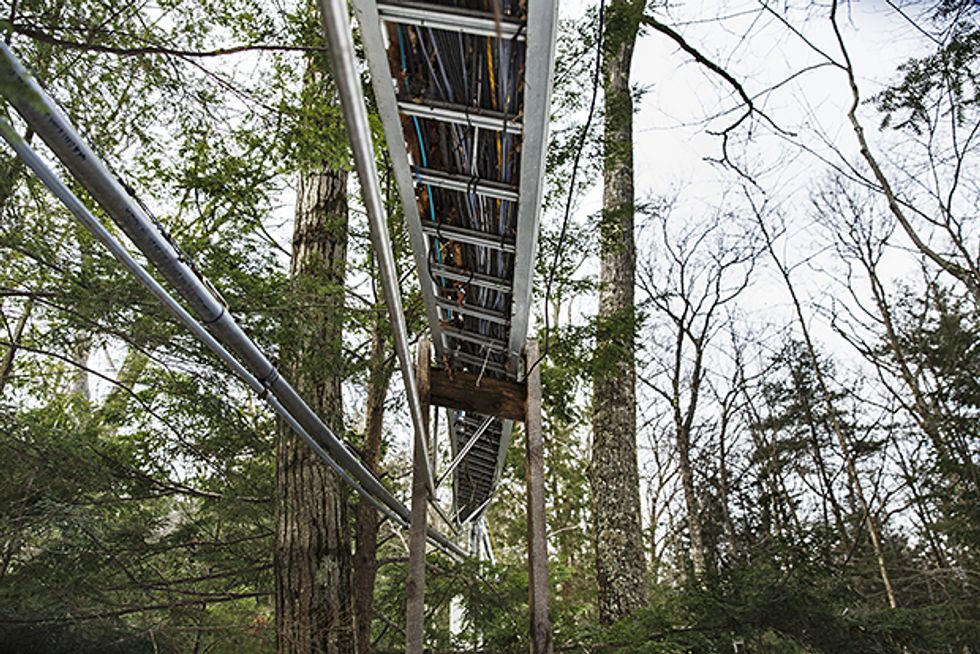
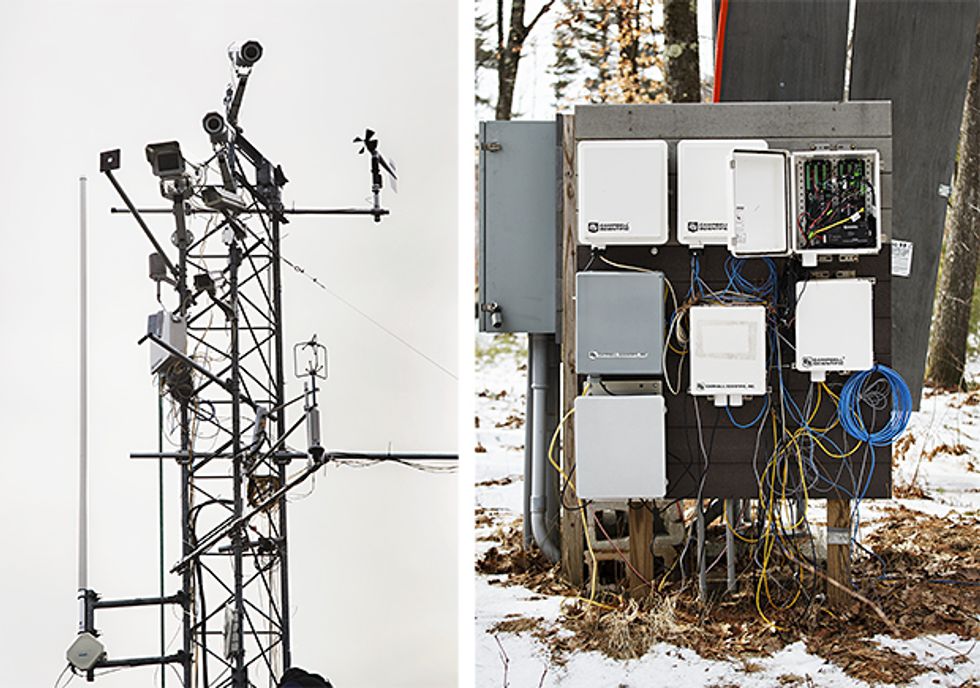
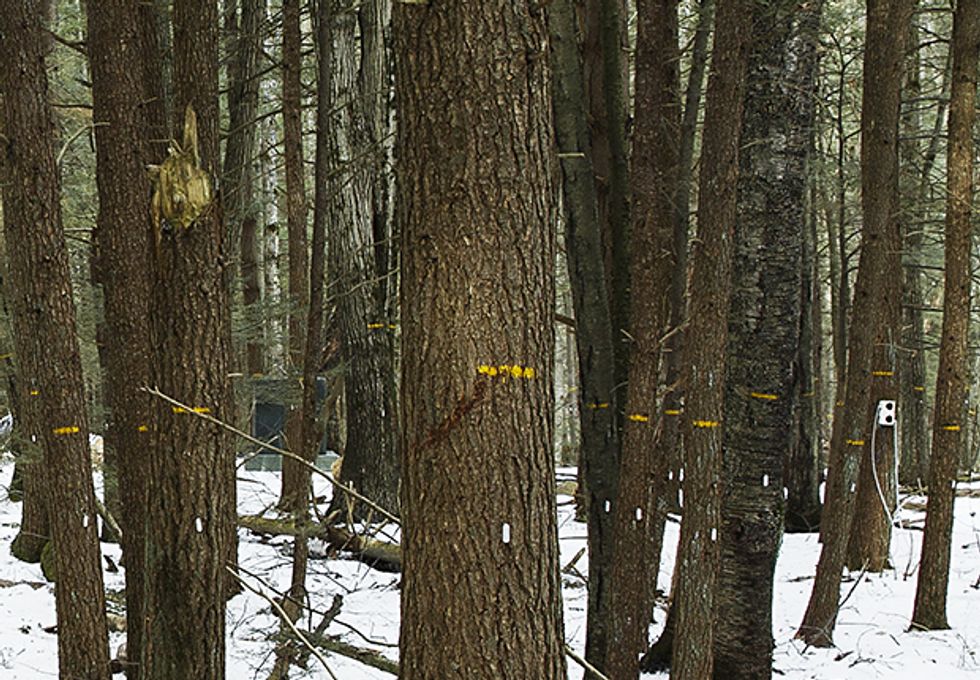 The Forest Backbone (top) extends the network to a tower, which samples trace gases. Trees with yellow marks (above) have been studied individually for decades. The National Ecological Observatory Network tower (below) measures atmospheric changes.Photos: Bob O’Connor
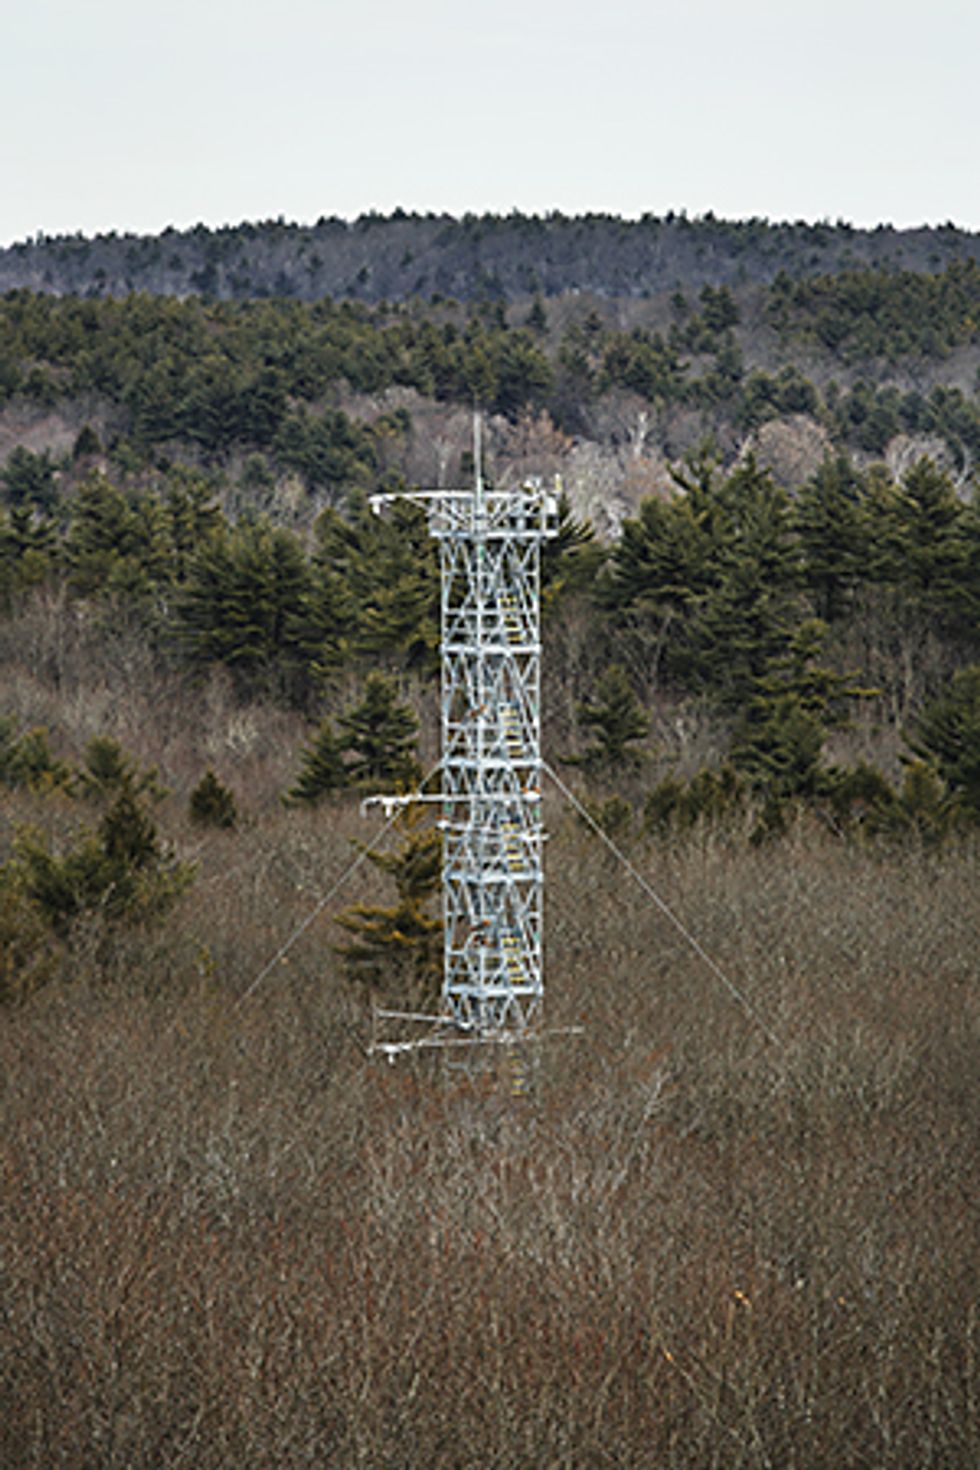 Photo: Bob O’Connor
Until now, forest ecologists have been forced to largely ignore this complexity, focusing instead on the most obvious linkages or easily compartmentalized processes. But what if they could carve out an ecosystem small enough to let them measure pretty much everything happening within it, and to keep doing so for years on end? If the natural, underlying processes in this small volume could be understood and its connections unraveled, then it should be possible to predict what will happen in this corner of the world as the planet warms.
Such a living network exists in a woodland in central Massachusetts. But you could walk right through this preserve without noticing that its trees have eyes and its meadows, ears. Nevertheless, knowledge gathered here is already leading to fundamental discoveries about the wilderness, its biological processes, and how they have changed over the past 25 years. And it seems set to allow scientists to formulate strategies to mitigate the worst effects of climate change for forests, woods, lakes, grasslands, and farms around the globe. As any economist will tell you, that could be worth trillions of dollars in a world already experiencing shifts in agriculture, precipitation, extreme weather, and wildfires.
April at the Harvard Forest finds snow still blanketing the ground, bare trees sagging under a wintry chill, and stone walls skirting the memories of long-abandoned farms. At first glance it looks as it might have back in 1907, when Harvard University acquired 1,520 hectares of land in Petersham, Mass., as a living laboratory for botanists.
But here, bright orange cables are snaking halfway up a tree. There, cryptic dials on a slim gray box are crusted with frost. And overhead, visible through the branches, metal towers bristle with antennas and cameras. For this forest is pervaded by a digitized network of sensors that scrutinize growing plants, scurrying animals, waterways, and the air itself. Primary electric power is supplied to many research plots in the forest, while more remote devices use batteries. Thousands of sensors make millions of observations every day, monitoring the soil, the streams, and every breath of wind. If a tree falls in the Harvard Forest, rest assured that a gadget is positioned to hear it.
From the very beginning, Harvard has gathered data here. At first, scientists tracked the health of trees and vegetation for forestry. But since 1988, the Harvard Forest has also been a Long-Term Ecological Research (LTER) site, funded by the National Science Foundation. This designation broadened its mandate to observe other aspects of forest dynamics, focusing on its rivers and streams as well as changes in the air that sweeps by.
Such studies posed problems. Deluges of data from atmospheric monitors would fill the largest hard drives in days, forcing scientists to trek around the forest swapping them out. And though the trickle of data from watercourses could be logged for much longer, that longevity came with risks. “Murphy’s Law says that when you only get out to these once a month, if you have a problem it’s going to be the day after your last visit, and you’ll lose a month’s data,” says Emery Boose, who manages the forest’s internet of trees.
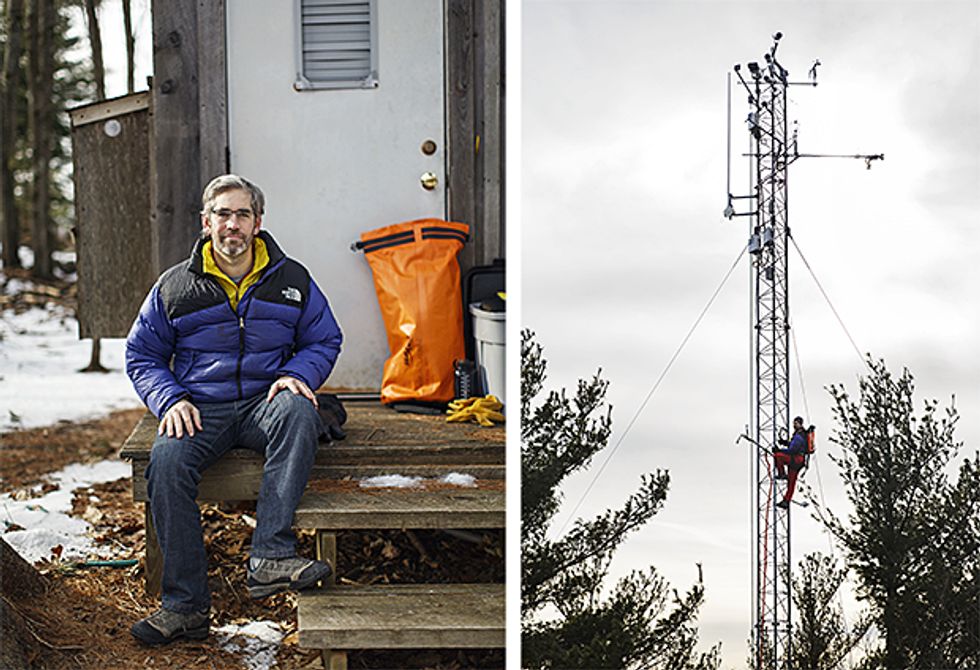
 Andrew Richardson (above left) regularly climbs towers (above right) that are topped by a clutch of “phenocams” (bottom left), which feed data to logging devices on the forest floor (bottom right)Photos: Bob O’Connor
In 2010, Harvard Forest researchers decided to move to a wireless network. But tall trees and steep hills created dead zones that a traditional Wi-Fi network could handle only with scores of access points. A high-powered cellular system, on the other hand, would cost a lot of money and need regulatory approval.
In the end, the project’s engineers concocted an ingenious hybrid of three kinds of wireless technology. Five towers poking above the treetops provide the main backbone for the network, communicating via 5.8-gigahertz radio links capable of very high data rates. Because these high-frequency signals are attenuated by foliage, a dozen 900-megahertz radios are used to punch through leaves and branches. The third leg of the hybrid consists of a handful of 2.4-GHz Wi-Fi access points at ground level to provide Internet access for the laptops and smartphones of researchers working nearby.
Aside from signal-sapping foliage, nature has other devilry. Animals chew on cables, ice builds up on metal equipment, and storms knock down trees and cables. But the main enemy is lightning. Every summer, dozens of bolts surge into the towers. The towers are well grounded, of course, so many strikes are not even noticed. However, says Boose, “last summer we had three or four episodes of significant damage. Our insurance company realized that this was no longer a good business model for them, so we aren’t able to insure any longer.” To keep replacement costs down, the forest now uses hand-me-down switches and access points from the main university campus.
Each experimental site in the forest has many devices and sensors associated with it. Some are gathering information for a particular project; others are collecting background data that could help scientists years from now. A weather station, for example, collects a full set of meteorological data every second, including air and soil temperatures, humidity, precipitation, and solar radiation. Meanwhile, the level and flow of every stream is monitored by ingenious pressure meters whose trick is to force water through a carefully shaped trough where the height of water is proportional to the rate of flow.
Nestled in the undergrowth are three Raspberry Pi–powered acoustic sensors. They are part of a pilot project to survey birds and insects by detecting their distinctive songs. Each unit, built for US $100, records every sound within a radius of 10 to 15 meters, compressing and wirelessly transmitting audio over the Internet to researcher Erik Sobel’s office on the outskirts of Boston. “Nobody is going to sit and listen to terabytes of sound data,” says Sobel, whose background is in target and pattern recognition for defense applications. He is now working on algorithms to identify different forest species. “The concept is to develop low-cost technology that can automatically detect when the first cardinals arrive in the spring and when the earliest crickets chirp, then correlate that with temperature and so on.”
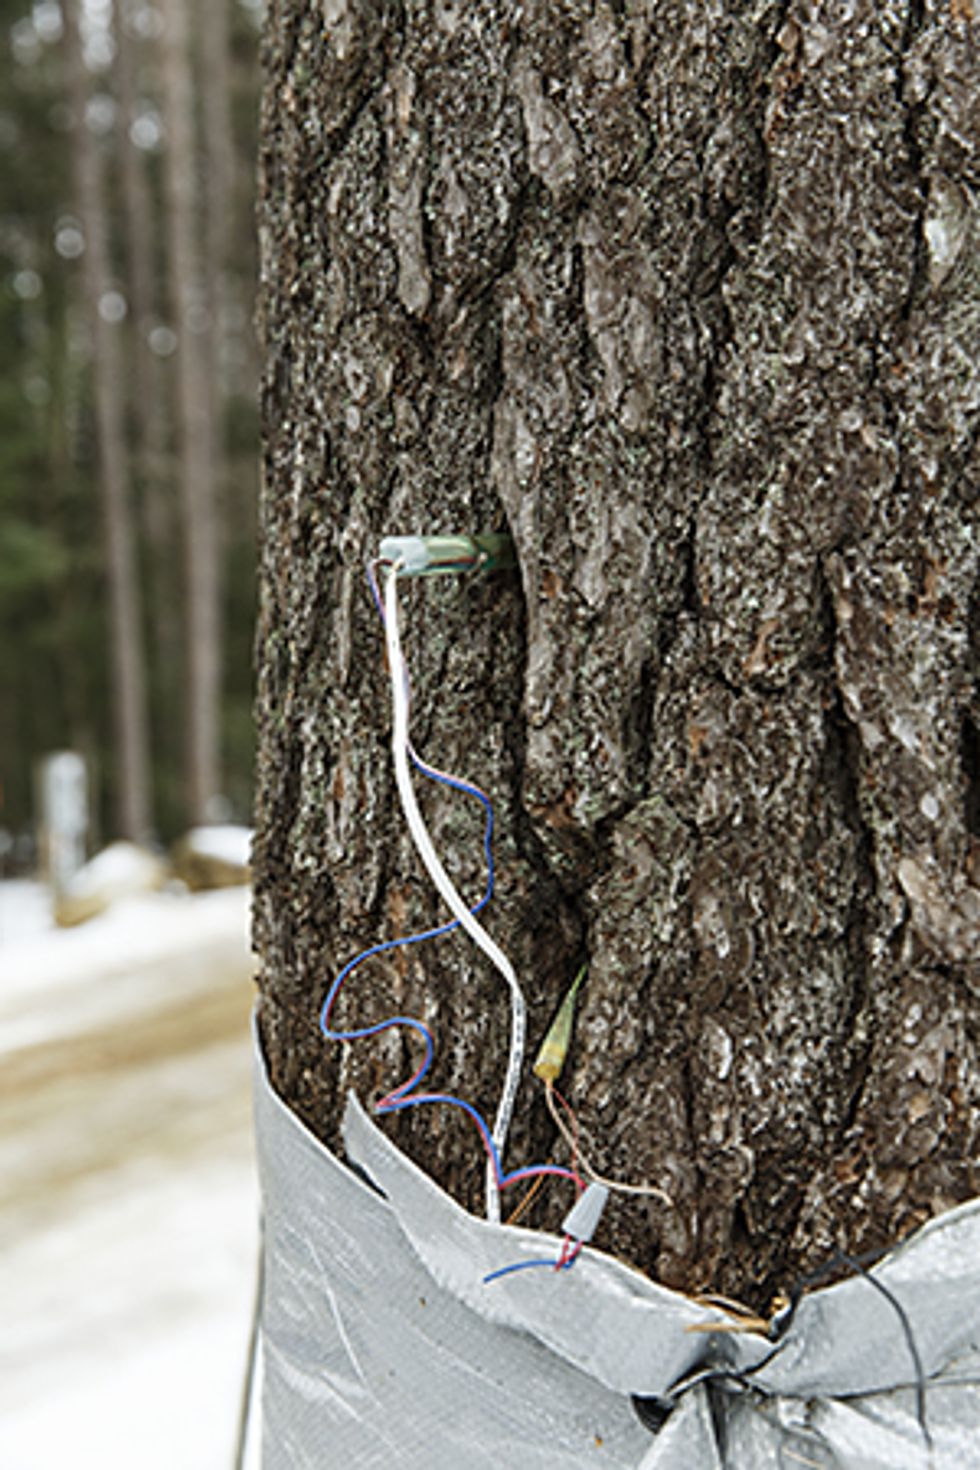 A Sap Sensor (above) contains two needles, one of which is heated. The temperature gap reflects sap flow, a measure of the tree’s health.Photo: Bob O’Connor
This process of studying natural cycles is called phenology, and it is the core of the Harvard Forest mission. Every year since 1990, Harvard investigator John O’Keefe has been noting when the leaves of dozens of tree species first bud in the spring and when they change color and die in autumn. Now his role is in danger of being usurped by cameras mounted high above. Harvard biology associate professor Andrew Richardson first put a digital camera on a tower at the Harvard Forest in 2005, to “get some pretty pictures to illustrate lectures.” But he soon realized that by comparing colors in time-lapse photos, he could track and identify seasonal changes. The dozens of “phenocams” he has installed at 12 locations around the United States have captured more than 5 million images. “We’re doing what satellite remote sensing does,” says Richardson. “But we’re doing it with cameras that cost a couple of hundred dollars rather than a hundred million.” To be fair, many satellites capture far more than just visible light. But by comparing phenocam data with images shot from orbit, Richardson can quantify uncertainties in the satellite data.
“We’re improving satellite data for the whole world,” says Richardson. He is now using thermal cameras to follow trees’ responses to heat stress, and he has even installed an aerial tram that scoots over the canopy on wires. The tram carries sensors that measure the canopy’s height, color, and ability to absorb different wavelengths of light—a key indicator of photosynthesis and plant health. The tram can be controlled from a Web interface via its 2.4-GHz ZigBee radio; it returns its data the same way.
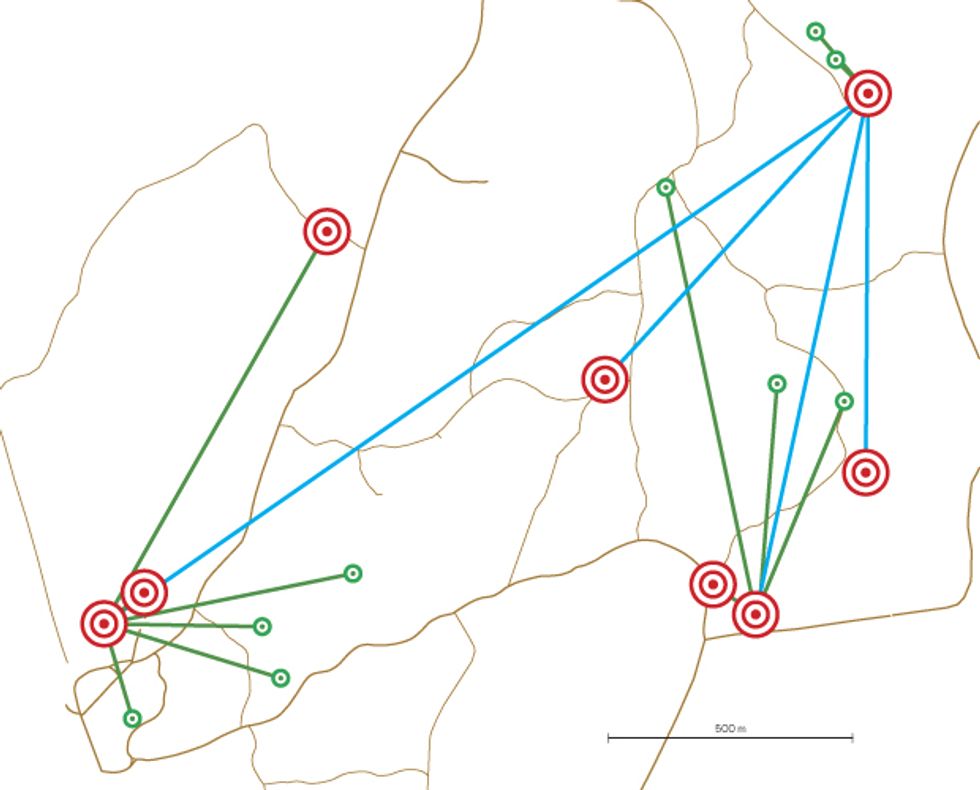 A Threefold Hybrid of wireless technology connects the forest’s far-flung sensors. Five towers above the treetops communicate via 5.8-gigahertz radio links (blue); other 900-megahertz radios penetrate leaves and branches (green). Several 2.4-GHz Wi-Fi access points at ground level serve the laptops and smartphones of researchers working nearby (red).Source: Harvard Forest Project
Alongside the cameras—and the main reason for Harvard Forest having towers at all—is a host of atmospheric sensors. Eddy flux devices measure tiny swirls in the wind and, with the help of infrared analyzers, track the movement of gases in the air several times a second. There are six of these systems mounted at different heights on each tower, from the forest floor to clear air above the canopy. Researchers can thus follow the absorption of carbon dioxide and the emission of water vapor, as well as the changes in man-made pollutants like ozone and oxides of nitrogen.
Harvard Forest’s eddy flux towers have been collecting data since 1991—“the longest time series like that in the world,” says Richardson. It allowed Richardson and colleagues to prove last year a long-held suspicion that forests are now doing more photosynthesis with less water than in the past. As carbon dioxide levels in the atmosphere rose from the combustion of fossil fuels, trees actually removed and stored more of it.
This extra carbon sequestration might seem like good news. But ecologists are trying to understand what the secondary effects could be. And a few are not prepared to wait decades to see how climate change might develop: They want to see it today, with real-world simulations of global warming.
One of the very first LTER experiments used underground cables to heat a few hundred square meters of the forest floor to five degrees centigrade above ambient (a temperature gain that we may face late this century). The goal was to study how the heat affected the amount of carbon dioxide released by the microbes. Understanding this process matters hugely because soil microbes already release nearly 10 times as much carbon dioxide each year as human activity does. The researchers discovered that the microbes in the soil at first released more carbon dioxide than before. But as the years passed, emissions fell again as the microbes adjusted to the warmth.
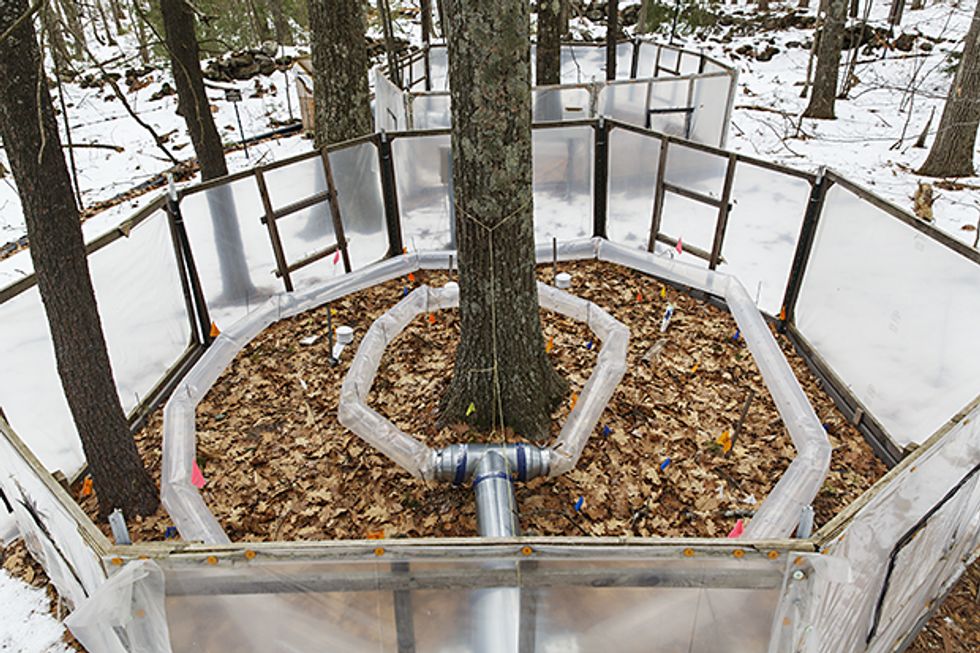 Aaron Ellison (right) puts ants in chambers (above) heated by hot air to model the effects of global warming.Photo: Bob O’Connor
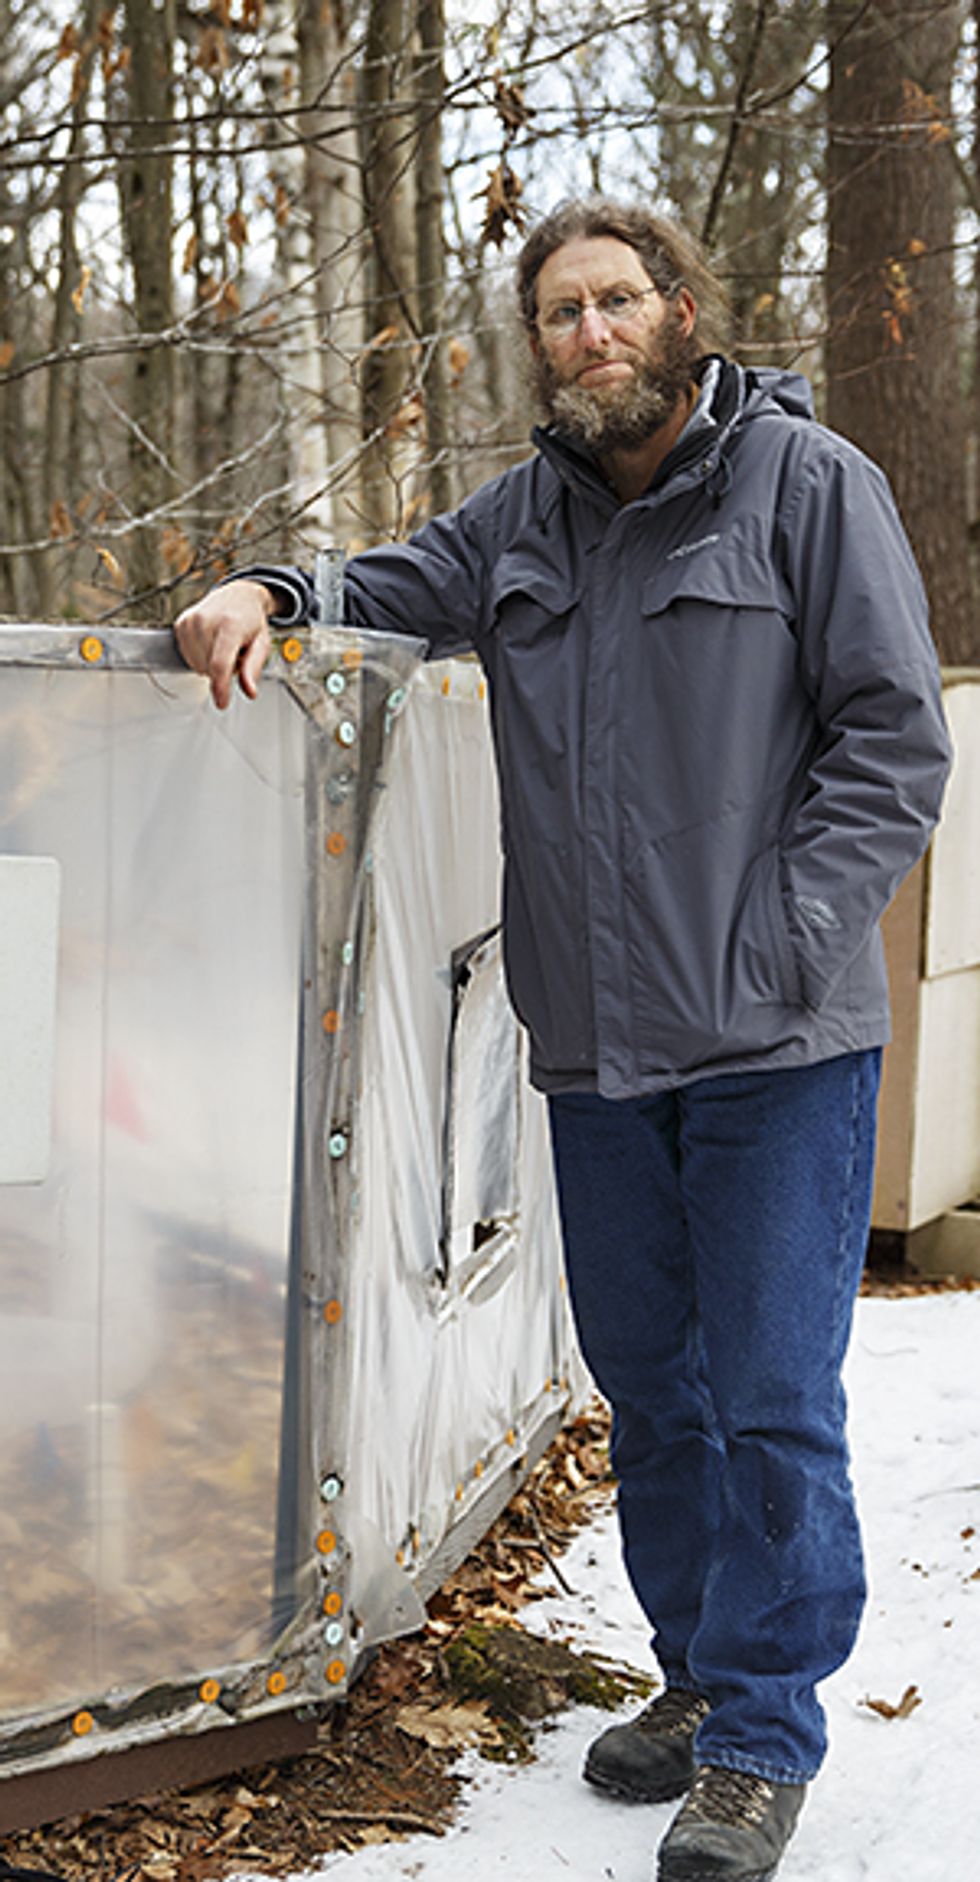 Photo: Bob O’Connor
Tall trees are harder to heat up. Pamela Templer, an associate professor at Boston University, decided to start at the roots, in a project that’s testing the counterintuitive notion that a warming environment might mean colder soils. The U.S. Northeast’s famous winter storms deposit a blanket of snow early in the winter that insulates the ground from frigid air later on. As temperatures rise in years to come, climate models predict less snow but still freezing temperatures.
To simulate this, Templer’s team shoveled away the first snows from beneath 12 red oak and 12 red maple trees at the Harvard Forest. They then fitted each tree with three sap-flux sensors, each consisting of two needles, one of which is heated. The temperature difference between the needles reflects how well water is flowing up the trunk, a measure of the tree’s overall health. As the seasons progressed, the sap of the red maples slowed down, while that of the red oaks did not. Templer believes that the red oaks were less affected by freezing soil because their roots generally run deeper into the earth.
The most ambitious simulation, however, involves some of the forest’s shortest-lived residents: ants. These insects create an inch of topsoil in North America every two centuries, replenishing soil lost to farming. To observe how warming might affect their behavior, ecologist Aaron Ellison set up dozens of chambers on the forest floor and heated them to successively higher temperatures, ranging from 0.5 °C to 5.5 °C above those of the ambient air. (The heating bill for his hot air blowers alone is $50,000 a year.) The ants are free to come and go from the chambers, and their numbers are sampled each month. Most of the ants at the Harvard Forest adapted to the higher temperatures, continuing to generate topsoil as before. However, some species at an identical setup in subtropical North Carolina either left the chambers or perished.
A World of Woven Trees
Harvard Forest hosts scores of research projects, some of which go on for decades
 Illustrations: MCKIBILLO
Phenocams
Six cameras shoot images at 30-minute intervals during daylight hours. The hundreds of thousands of photos captured are used to create a “greenness index” of the forest. The cameras can determine the precise biological beginning of spring and autumn to within a day.
Eddy flux tower
Installed in 1989, the tower is 30 meters high and located 1.7 kilometers from forest headquarters. It provides the world’s longest continuous record of net ecosystem carbon dioxide exchange, evaporation, and energy flux between the atmosphere and the forest. Individual sensors measure the air multiple times a second, and the gas exchanges are recorded at hourly intervals.
Weather station
The station measures air temperature, relative humidity, precipitation, incoming and net radiation, barometric pressure, wind speed and direction, and soil temperature every 15 minutes. Hydrological stations record stream discharge and water temperature at four stream sites, and water level and water temperature at two wetland sites. A pressure-sensitive “snow pillow” measures the rate of snowfall and the water content of the snow pack over the winter.
Ant warming
An open-top chamber simulates warming from a change in climate of between 0.5 °C and 5.5 °C. The annual heating and electricity costs are $50,000. Ants are sampled every month to see which species thrive and which leave or die off.
Acoustic mapping system
Three $100 devices monitor audio in the forest: bird, animal, and insect life, as well as tree falls and human activity. Devices use Raspberry Pi hardware running Linux and include Wi-Fi and a microphone that samples audio at 24 kilohertz. Data is streamed continuously to remote hard drives. Future plans include algorithmic identification of individual bird and insect species.
Hurricane-manipulation experiment
In 1990, the experiment simulated a large hurricane in a 0.8-hectare (2-acre) forested area by pulling down trees with a large winch. Researchers have studied the regrowth of tree species since then, as well as the response of the forest ecosystem to a catastrophic storm. Such hurricanes have traditionally occurred only every 50 to 200 years, but that could happen more frequently with climate change.
Megaplot
This 35-hectare plot of the forest precisely maps woody stems over 1 centimeter in diameter—more than 116,000 stems in total. It is part of the Forest Global Earth Observatories, a project of the Smithsonian that tracks the function and diversity of over 6 million trees in 24 countries around the world. Harvard Forest is one of the first temperate forests in the project. It will remeasure the trees every five years.
Hemlock removal
Researchers simulated the arrival of the invasive Asian woolly adelgid bug by deliberately killing hemlock trees in 6.5 hectares of the forest. Within the next 10 years, wild hemlock trees are predicted to die off completely in the United States. The study monitors the impact on native wildlife by regularly assessing each woody stem that’s at least 30 cm long, for browsing by moose, porcupine, and deer.
Predicting ragweed-allergy hot spots
A three-year field survey gathered data on pollen from 1,250 specimens of common ragweed, a species that causes hay fever. Expected outcomes include better predictive tools and maps for forecasting allergy hot spots, as well as models of how climate change affects human exposure to pollen.
Detritus Input and removal treatments (DIRT)
Researchers study forest soil by measuring respiration, nutrient leaching, and various chemical properties. Results last year suggest that sequestering carbon in forest litter (to offset burning fossil fuel) is probably not practical.
Microbes, ants, and oaks: With continuing investigations starting to come together, Ellison refers to an “ecosystem of experiments” at the Harvard Forest, whose interconnections mirror those of the forest itself. For example, he has also sampled ants from an experiment originally designed to study the effects of warming on plants, while other researchers are making use of an experiment that is manipulating the canopy (ostensibly to track the decline of hemlock trees) to see how climatic changes might affect plants and animals beneath. “We do these parallel experiments all the time,” he says.
“We would love to have a crystal ball that says, ‘In 100 years the temperatures are going to increase by x and the forest is going to respond with y,’ ” says Templer. Accurate forecasting could allow governments to plant appropriately adapted species, manage development, reduce the spread of invasive species, and ultimately make climate change less disastrous for all of us.
Accelerating data collection is one of the most important techniques that researchers are using to get to that goal. Take “water budgets”—the balance of precipitation, runoff from streams, and evapotranspiration, the water returned directly to the atmosphere through evaporation and the respiration of plants. Many ecologists have been tracking it at various sites for decades. But this monitoring is typically conducted on an annual timetable. Now, the Harvard Forest can provide accurate numbers on a daily or even hourly basis.
Senior investigator Boose hopes this trend will lead to a new kind of prediction. “We’ve gotten pretty good at forecasting the weather, but no one’s ever really been able to do ecological forecasting,” he says. “To do any sort of prediction, you need access to data quickly. New wireless techniques give us the potential to pull this all together and calculate water budgets that are right up-to-date.”
Even if Harvard succeeds in predicting the behavior of its own forest, questions remain about how that success might apply elsewhere. So far, ecological experimentation has been of just two kinds: hyperlocal but richly detailed, such as John O’Keefe’s painstaking observations of the first spring buds in the Harvard Forest, or global in scope but thinly observed, such as satellite data of the same phenomenon. To fill the gap between these extremes, another tower was put into service in Petersham last summer. Although it carries many of the same meteorological and atmospheric instruments as Harvard’s other structures, it is just one of 60 identical towers that will rise in every ecoclimatic domain of the United States, from Alaska’s tundra to Hawaii’s beaches. Every site in the National Ecological Observatory Network (NEON) will measure the same things, in the same way, at the same time, for the next 30 years.
“When you integrate studies from different investigators, using different techniques, you get a large error band,” says Elizabeth Blood, NEON’s program director at the National Science Foundation. “With NEON, we’ll reduce the error bands so we can begin to see patterns and interconnections that weren’t visible before.” The data from NEON’s continent-spanning towers, as well as its three airborne observatories, 46 aquatic sites, and thousands of citizen scientists, will quickly be made available online.
“We want to develop a forecasting capability just like the weather service,” says Blood. “NEON will help us reduce the noise in the data and give us the ability to make predictions in both the near and longer terms.” Richardson’s group is working with NEON to start the first citizen-science program. The effort will make use of the Zooniverse website, which recruits volunteers to work as scientists’ helpers. Users will check the network of minicams for features that often elude conventional computer-vision systems, such as signs of flowering or snow on the ground. The $450 million NEON project should be fully operational by 2017, just in time to share data and insights with networked forests in Australia, Brazil, Canada, Costa Rica, Singapore, and the United Kingdom.
Climate change, of course, is a global issue. At the moment, these big-budget efforts are largely confined to the richer countries. “There are still large parts of the world we don’t know that much about,” admits Richardson.
But mighty forests from little acorns grow. One day, the tools being pioneered in this small New England forest might help realize a global ecological prediction network, one in which everything is connected to everything else.
About the Author
Contributing editor Mark Harris has written for IEEE Spectrum on defibrillators, patents, computer gaming and Google’s self-driving car. The British-born Seattleite now adds environmental science, an interest he cultivated last year as a Knight Science Journalism Fellow at MIT.
This article originally appeared in print as “The Internet of Trees.”