
It takes me 25 minutes to get to work via London’s Tube, and about the same time to cycle to work. I prefer to cycle—the Tube is crowded and prone to delays—but there are times when it’s too cold or wet to avoid the train. Last year, I realized that making the decision before my daily commute to cycle or take the Tube had become a surprisingly complex affair. Transport for London, which runs the city’s transit network, opened up its application programming interfaces (APIs) in 2010 to developers as part of the London Datastore, which aggregates data from a number of public sector organizations serving the city (https://data.london.gov.uk). This led to the creation of dozens of status and travel planning apps for commuters. Consequently, I’d check the weather forecast the evening before and the status of the Tube on my phone in the morning. I’d hooked up an instant messenger alert (via the IFTTT.com service) for rain. None of this was particularly draining, but it was an extra bunch of things that made Monday mornings a bit more Monday morning-ey. I wanted something that would handle all that data and help me spend less time choosing and more time drinking my tea. So I created the Bicycle Barometer, with a needle that swings between a bicycle and a Tube icon depending on the conditions.
In my day job in the United Kingdom’s Government Digital Service, I had got used to ambient information from screens that dot the office. These provide real-time updates about the progress of various projects. I wanted a bit of that for home—something I didn’t need to tap or click to check, something that was just there.
How I could achieve that came to me in April 2011 at a Rewired State “National Hack the Government Day” event, when I started playing with a Nanode microcontroller. The US $50 Nanode is an Arduino-like microcontroller designed by a group at the London Hackspace, with Internet connectivity built in. I’d had various Arduinos sitting about for a while, with the intention of learning how they work and building something network enabled. But this never quite happened: Getting an Arduino connected to the Internet requires a separate Ethernet “shield” component, which were hard to get hold of at the time. So a Nanode was just what I needed.
However, connecting the Nanode was still a little tricky. First I had to figure out some things at the local-area-network level, such as divining the hardware media access control (MAC) address used to identify the board on the physical Ethernet network. Learning how to read a value from a server on the Internet also took some time.
Coming from a Web programming background, I had difficulty getting my head around creating microcontroller code to handle connections and process the results, so I decided to keep the Nanode software fairly dumb. I programmed my Nanode to read just a single value from the Internet and move the barometer’s needle to a position based on that value. The hard work of determining that value would be done on a Web server, where I set up a Flask application on the Heroku cloud application platform. Flask is a lightweight framework for creating websites that use the Python language. It’s great for simple applications that don’t require a database. Heroku is a good fit for hosting Web applications made with Flask, and it’s free for low usage.
Next I had to decide what data to gather and how to boil it down to a single value. The U.K. government’s Met Office provides an API that gives 3-hour forecasts for 5000 locations across the United Kingdom, detailing 30 weather types (mist, drizzle, sleet, thunder, and so forth) along with the wind speed, temperature, and pollution level. For public transport information I used the Live Tube API from Transport for London, which tells you if a station is open (I wanted to know about Brixton station) and the status of each line (in my case, I was just interested in the Victoria line).
To turn the weather and transportation data sources into something meaningful, I started with the number 100, which means “You really should cycle!” The Python code deducts points for bad weather: 10 points off if it’s under 15 °C, 30 points off if it’s going to drizzle, 75 points if it’s going to thunder, and so on. Points get added if the Victoria line is not running in good service or if Brixton station is shut. Once all the additions and subtractions are done, my Flask application outputs a number between 0 and 100, which the Nanode reads as plain text.
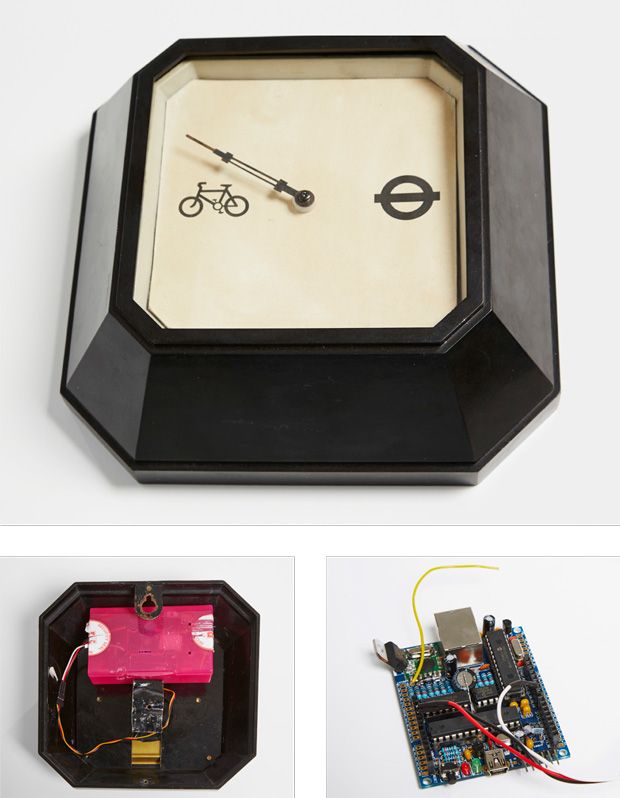
I wanted to make the final product look nice as well as be useful, something I could hang on a wall. I removed the workings from an old clock I bought for $15 to accommodate the Nanode and a cheap 5-volt servo I bought from Amazon.com for $8. I printed the Tube logo and the cycle icon used on British street signs onto a piece of card and mounted it in the clock, staining the card with a cold tea bag to age it. I mounted the servo behind the clock face and screwed one of the clock hands to the front of it. Then it was straightforward to make the Nanode convert the 0 to 100 value from the Flask application to 0 to 180 degrees and rotate the servo to move the hand to the appropriate point on the dial. I set it to check the Flask application every 10 minutes for changes.
Having lived with the Barometer for a few months, and with a little tweaking of the weightings, I’ve found it surprisingly accurate, although the weather’s been pretty bad, so it’s mostly been pointing at the Tube sign! There’s still room for improvement, though—I’d like to add information about daylight hours and maybe real-time pollution data.
The Barometer has also triggered ideas for future projects that take small chunks of information from the Web and display it on a physical thing: I’ve just finished a whiteboard with six dials that uses a projector to display arbitrary values from a Google spreadsheet based on the dials’ settings. I’m also thinking about building something for my brother that tells him about conditions at his local golf course.
This article originally appeared in print as “The Bicycle Barometer.”
To Probe Further
For the source code for both the Heroku and microcontroller applications used to drive the Bicycle Barometer, visit https://github.com/memespring/bicycle-barometer/tree/master/web.