
It’s rare that an academic researcher gets to experience the life of a stunt pilot, but we found ourselves in more or less that position this past May, as we flew over the ice-covered fjords of southeast Greenland. It was exhilarating—and a little scary. We were riding in one of NASA’s research aircraft, a P-3 Orion turboprop, on which we had installed a special kind of radar for probing glacial ice. Although our equipment can work at higher altitudes, other science instruments needed to be flown low, over terrain so rugged that at times we came within a mere 30 meters of the ridges—near misses that our downward-looking radar measured for us while we peered out the window holding our breath.
Crisscrossing over this vast expanse of whiteness by air, you can easily forget that Greenland’s huge endowment of ice is slowly disappearing. The eight-times-larger Antarctic ice sheet appears to be shrinking, too, particularly around the periphery. These two areas hold 99 percent of the land-based ice on Earth, and as it melts, the water that runs off flows into the oceans, adding to their rising level. Meanwhile, most mountain glaciers, which contain the remaining 1 percent of the ice perched on land, are also retreating, further compounding an increasingly urgent problem. If sea level goes up by a meter over the next several decades, as many scientists suspect will happen, it will disrupt the lives of countless people around the world.
Will sea level really rise a meter? Or could it go even higher? And if so, how fast? Although the computer models of the ocean and atmosphere are good enough to gauge how much temperatures will likely climb over the next century, current ice-sheet models leave much room for improvement. In particular, they don’t account for many of the factors that are causing ice sheets to thin and sea level to rise.
One of the main problems is that these models lack important details about what’s going on where the ice meets the bedrock—whether the bottom of a particular locale is flat or sloping, whether there is liquid water lubricating the contact, that sort of thing. Those details in turn determine how quickly the ice will flow toward the sea.
The best way to get that information is by sending radio waves into the ice and examining the echoes. This can be done with downward-looking radar equipment that’s either towed over the ice or flown in aircraft, like the P-3 that carried us over Greenland.
The idea of using airborne and surface-based radar equipment to investigate polar ice sheets isn’t new. In fact, it’s many decades old. But we’re trying to bring such radars into the 21st century—a century that’s desperately in need of the insights that better radar surveys of these great accumulations of ice can provide.
The first inkling that radio might be useful for investigating ice sheets came during the 1930s, when the men working at the Little America base in Antarctica realized that snow and ice are transparent to radio waves. But it wasn’t until the late 1950s, after pilots reported that their radar altimeters were useless over ice, that electronics technician Amory Waite Jr. and others figured out how to use radar altimeters to measure the thickness of polar ice.
Over the next few decades, researchers from Canada, Denmark, the Soviet Union, the United Kingdom, and the United States devised various surface-based and airborne radars for probing ice. This equipment not only allowed scientists to map the bedrock hidden far below the thick ice sheets of Greenland and Antarctica, it also revealed internal layering within the ice, which can arise from the presence of air bubbles, density changes, liquid water, and even ancient dustings of the former ice surface with volcanic ash.
But such radars suffer from a fundamental problem: They can’t detect the direction from which the radar echoes emerge. Such systems assume that the radio waves travel vertically downward and their echoes come straight back up. Accordingly, the time delay between the emitted radar pulse and its echo is supposed to indicate the depth of whatever surface is causing the reflection, say, the rock on which the ice sits.
The radio waves aren’t only transmitted straight down, however, because the antennas used for probing ice can’t provide the needed directionality. For an antenna to be directional, it has to be many times the size of the wavelength it transmits or receives. These ice radars typically operate at frequencies between a few tens and a few hundreds of megahertz, corresponding to wavelengths that range from about 1 to 10 meters. A few go as low as 1 megahertz (a wavelength of 300 meters). For any of these radars, you’d need an enormous antenna to obtain a narrow vertical beam. But toting around an antenna the size of a football field or larger just wouldn’t work—the antennas must be much smaller to be practical. So these ice radars invariably receive some echoes coming in from odd angles, which tend to confuse the interpretation of the results. This difficulty is especially troublesome in places where the bedrock is very uneven or where the ice surface is especially rough.
Another shortcoming of the simple radio echo-sounding systems that continue to be widely used is that, even where the bedrock topography is obligingly gentle, these radars can tell you only what’s directly below your feet. So to map out a large area, you’d need to make measurements over a lot of closely spaced tracks, as though you were mowing some huge white lawn. Otherwise, you couldn’t be sure you weren’t missing some significant feature located between adjacent passes of your equipment.
Our group at the University of Kansas’s Center for Remote Sensing of Ice Sheets, in collaboration with others at the Byrd Polar Research Center at Ohio State University and the Center for Ice and Climate at the University of Copenhagen, has devised a way around these limitations: using signal-processing tricks from the world of synthetic-aperture radar, a common technique for mapping the surface of the Earth and other planets.
We aren’t the first to apply synthetic-aperture radar to glacial ice. Researchers at other institutions tried this approach in the 1980s with limited success, and even members of our own team attempted to assemble a synthetic-aperture radar for ice studies in the 1990s. But the electronics and computing power available then weren’t up to the job—one that turns out to be much harder than operating a synthetic-aperture radar over other sorts of terrain. To understand why that is, you need to know a little about how synthetic-aperture radar works.
Most synthetic-aperture radars are side-looking systems. The antenna could, for example, be pointed out the door of a plane, which would then fly to one side of the area on the ground that the operator wanted to scan. If the surface were perfectly smooth—say, an expanse of still water—the only radar return you’d get would be from directly below, where the radio waves hit straight on and bounce straight back. The radio waves striking the water’s surface off to the side would just reflect away from the plane.
But the surface you’re scanning is rarely perfectly flat. So you’ll also receive radar echoes from objects located off to the side—buildings, mountains, whatever. Because the antenna is moving (and the stuff on the ground isn’t), your results will match what you’d get if you’d made the measurements all at once with a very long antenna array. That is, the forward motion allows you to synthesize a long array, hence the name synthetic-aperture radar. To turn the many measurements into a well-formed image of the scene, however, you need to do some serious number crunching. The complexities of the required mathematical operations can be a little daunting, but the basic principles really aren’t that difficult to understand.
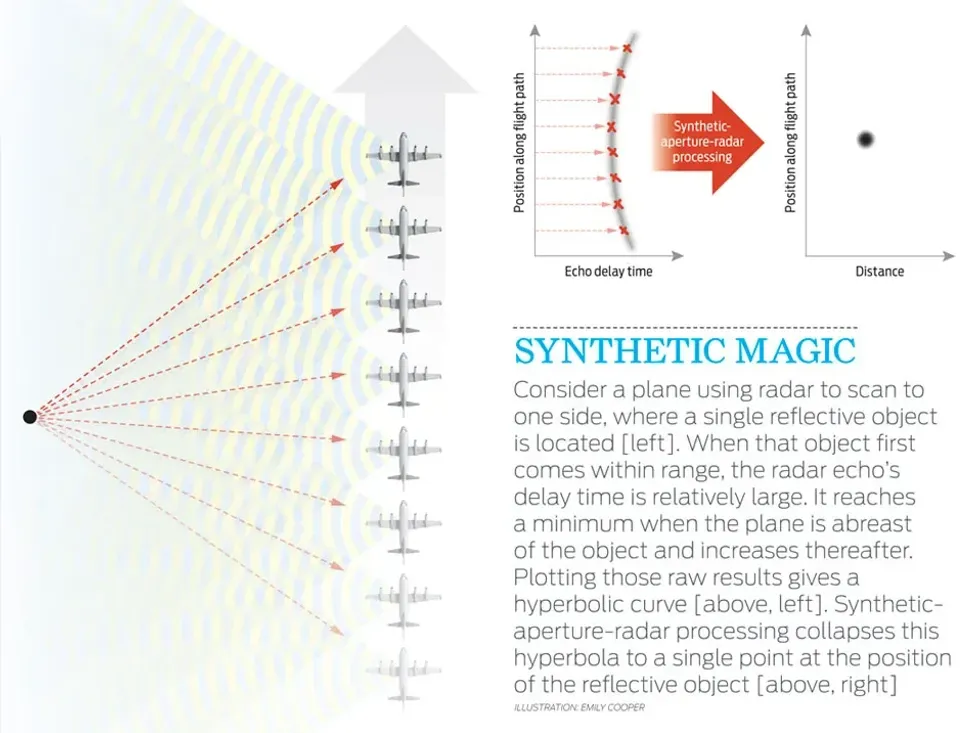
Imagine you are surveying a patch of ground with a side-looking airborne radar, and there’s just one object nearby that reflects radio waves—say, a metal flagpole. Imagine further that you’re doing this in total darkness, so you can’t see the pole. As your plane comes within radar range of the pole, you will start to receive reflected radio echoes from it. But the pole is still a long way ahead of you, so there will be a relatively long delay between the radar pulses sent out and the returned reflections. As the plane continues on, that delay will diminish, reaching a minimum when you come abreast of the pole. From there on out, the delay will increase.
Now, imagine that you’re using a pencil and paper to plot those received signals as a function of the echoes’ delay and position along your flight path, putting a mark wherever there is a radar return. At the start, the only echo you get from that lonely pole has a long delay, which gradually diminishes, reaches some minimum value, and then increases. So your sequence of plot marks will form a curved line (a hyperbola). If you then scan a few different flagpoles with radar, you’ll quickly come to recognize the characteristic curved line that each one creates. So when you next see a line with that distinctive hyperbolic curvature on your hand-drawn radar plot, you’ll say, “Oh, we must have passed another pole.” You’ll know that it was located directly to the side of your flight path at the point where the echo delay reached a minimum. Its distance from the flight path is also easy to work out from the delay time. Assuming you know where your plane flew, you can now pinpoint the position of the pole precisely.
The data processing that’s done for synthetic-aperture radar collapses the radio echoes that give rise to those curved lines into distinct points on a map. This is, of course, impossibly difficult to do by hand when there are many hundreds or thousands of objects creating a hodgepodge of radar reflections all at once, but an appropriately programmed computer can handle the required computations easily enough.
Our ice-penetrating radar differs from conventional synthetic-aperture radar in a key respect: Those systems look mostly sideways, whereas ours looks mostly down. And looking down, it turns out, is considerably harder. The reason is easy to see if we go back to our thought experiment.
Suppose your plane is flying high above an ice sheet with a single flagpole planted in the snow along its flight path. The minimum echo delay will come when the plane is right above the pole. But the delay won’t be all that much longer if the pole is located a little off to one side, because the distance between the plane and the pole won’t be that different. From the curved line you draw, you’ll still be able to figure out when the plane overflew the pole, but the sideways distance between the pole and the flight path will be impossible to determine precisely. The geometry of a down-looking radar makes that too tough to do using only the echo delay. That’s why we had to adopt an entirely different method to give our ice radar good resolution in the sideways direction.
What we really needed to know, and what normal synthetic-aperture radar doesn’t measure, is what direction the radio echoes were coming from. With that information, and with the usual measurements of the echo delay, we’d then be able to work out how far off to the side a reflective object is.
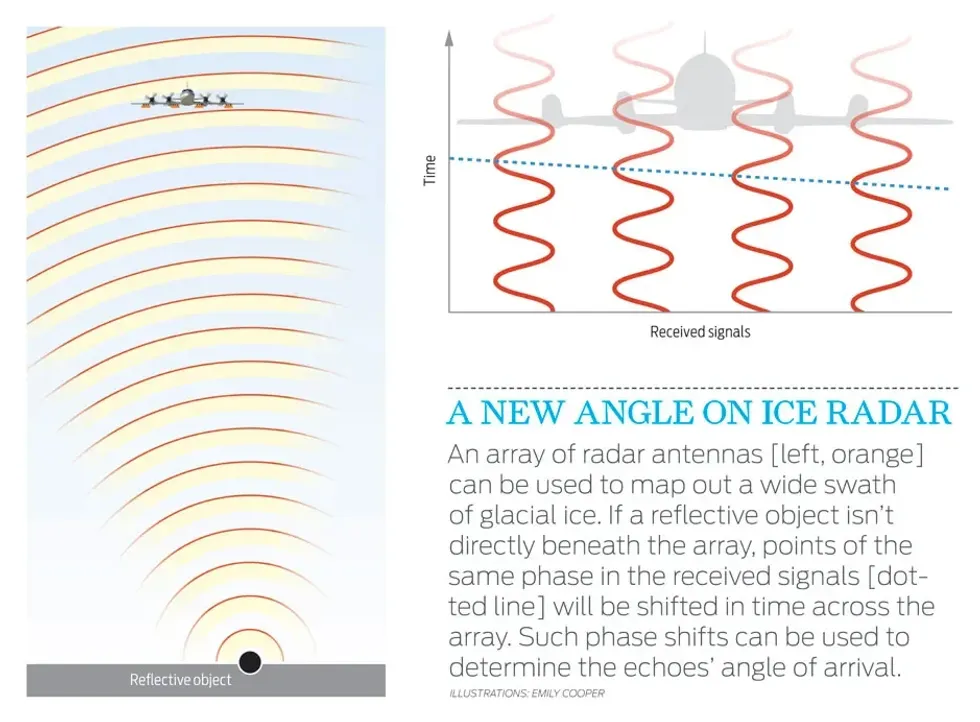
Fortunately, it’s possible to get this directional determination: You just need to use several radar antennas arrayed along a line that’s perpendicular to the path you’re following. That way, echoes coming in from one flank at an angle arrive at the antennas on one side slightly before they hit those on the opposite side. And by adding the appropriate time lags to the signals from the different antennas, you can make the array sensitive to waves arriving from particular angles.
This is standard practice in many radar systems, ones that use what are called phased arrays. They allow you to scan the sky in different directions without having to physically rotate the antenna. The challenge for us was that, given the limited size of the arrays we could fit on a surface sled or under the wing of a plane, standard array-steering techniques couldn’t provide as much angular resolution as we wanted.
To overcome that hurdle, we used a special signal-classification algorithm that was developed in the 1980s, which has proved very powerful for estimating the direction of arrival of various kinds of waves. We also needed to apply a correction that most people working with radar never have to worry about—for the bending of the radio waves as they pass through the ice. It took us a couple of years to work out the kinks in the hardware and the data processing, but eventually we had an impressive ground-based system assembled.
Our first opportunity to use that equipment came in 2005, at the U.S. National Science Foundation’s Summit Greenland Observatory—also known as Summit Camp—in central Greenland. Two deep ice cores were drilled there in the 1990s (one by U.S. researchers, the other by Europeans) in an effort to obtain a detailed record of past changes in Earth’s climate—a record that would go back more than 100 000 years. Ice cores can provide this history because they preserve various kinds of evidence of climate conditions during the ancient past, when the snow that formed the ice first fell.
One of the two cores drilled at Summit Camp showed particularly dramatic changes in composition in the 300 meters recovered from nearest the bedrock. Some climatologists interpreted that as evidence of ancient episodes of sudden climate change. But the other deep ice core, drilled just 30 kilometers away, had no such pattern at its base.
One explanation offered at the time was that the gradual flow of ice over uneven bedrock had caused the folding of internal layers, confusing the climate record. But for many years it was hard to know for certain whether this was the case. With our new radar, however, we were able to survey a swath of ice a few kilometers wide in a single pass, so it was relatively easy to map out the bedrock in a large area around the sites where the two ice cores were drilled. Our results showed definitively that the bedrock there is indeed quite rugged, with a deep channel adjacent to the site of the coring that suggested those ancient episodes of sudden climate change. Had the original researchers known that the bedrock there was so irregular, they would no doubt have drilled somewhere else.
The radar equipment we’ve constructed for seeing through ice is helping to tackle another major challenge in radio glaciology: sounding and imaging the margins of ice sheets. Those margins are difficult to survey because they have relatively warm ice near the bottom and lots of deep cracks on top. Also, some of the surface ice melts during the summer. The warm ice and liquid water attenuate radio waves, severely weakening the radar returns from the ice bed. Worse, the subtle radar echoes from the bed are often masked by strong waves bouncing back at odd angles from the rough spots on the surface. This isn’t usually a problem when surveying the cold interior of an ice sheet, because the surface of the ice is so smooth it acts like a mirror, reflecting radio waves away from the radar equipment.
These effects explain why prior radar surveys of many of the fast-flowing glaciers at the margins of Greenland’s ice sheet were unsuccessful. But our synthetic-aperture ice radar’s ability to discriminate the incoming direction of the echoes allowed it to do much better. In 2006 we were able to map for the first time the bedrock at a particularly challenging locale, the roughly 3-km-thick Jakobshavn glacier. This glacier flows down to the sea on the west coast, where it produces about 10 percent of the icebergs coming from Greenland and drains about 7 percent of the Greenland ice sheet. For reasons that aren’t entirely clear, this giant glacier sped up considerably, starting in the late 1990s. Just before then it was moving about 7 km per year, whereas currently it’s flowing at almost twice that rate. We are now well positioned to examine other fast-moving glaciers, which should help improve computer models of the dynamic processes that take place in these rapidly evolving masses of ice.
Such computer models are becoming increasingly important. For years now, scientists have been observing worrisome changes in the polar ice sheets. Will they stabilize, or will future transformations dwarf those already seen? Answering that question requires good models, which in turn demand detailed measurements of these ice sheets. And, right now at least, there is no better way to do that than using the advanced radar system we’ve developed. We just wish NASA’s P-3 pilots would fly a little higher.
This article originally appeared in print as “Beneath the Ice Sheets.”